Understanding COT Data for Grains & Softs Markets
Feb 15, 2026
Agricultural futures are the most diverse category in the COT report. The twelve markets we track span four sub-groups — grains, oilseeds, tropical softs, and livestock — each with its own positioning drivers. Seasonal patterns are stronger here than in any other asset class.
This guide covers all twelve markets, explains how they cluster into meaningful sub-groups, and highlights what makes agricultural COT data different from financial or metals positioning.
The Twelve Agricultural Markets We Track
| Symbol | Market | CFTC Code | Exchange | Sub-Group |
|---|---|---|---|---|
| C | Corn | 002602 | CBOT | Grains |
| S | Soybeans | 005602 | CBOT | Oilseeds |
| W | Wheat (SRW) | 001602 | CBOT | Grains |
| KW | Wheat (HRW) | 001612 | CBOT | Grains |
| SM | Soybean Meal | 026603 | CBOT | Oilseeds |
| BO | Soybean Oil | 007601 | CBOT | Oilseeds |
| SB | Sugar #11 | 080732 | ICE | Softs |
| KC | Coffee C | 083731 | ICE | Softs |
| CC | Cocoa | 073732 | ICE | Softs |
| LE | Live Cattle | 057642 | CME | Livestock |
| HE | Lean Hogs | 054642 | CME | Livestock |
| GF | Feeder Cattle | 061641 | CME | Livestock |
The three grain/oilseed futures (Corn, Soybeans, Wheat) have the highest open interest and institutional coverage. Coffee and Cocoa are the most followed softs internationally.
Why Seasonality Matters in Agricultural COT Data
Agricultural commodities follow planting and harvest calendars. These calendars create predictable windows of positioning activity that simply do not exist in financial markets or metals.
Corn and Soybeans follow the North American crop year:
- Planting season (April–June) creates uncertainty around acreage
- Summer growing season (July–August) is the most weather-sensitive period
- Harvest pressure (September–November) typically weighs on prices
- Speculative long positioning often peaks in late winter/spring (before the crop is established) and fades as harvest approaches
Wheat has two distinct crops tracked here: Soft Red Winter (SRW) planted in autumn and harvested early summer, and Hard Red Winter (HRW) with a similar but slightly different schedule. Speculative positioning in both wheat contracts often converges, but export competitiveness (US vs Australian vs Black Sea wheat) can cause divergence.
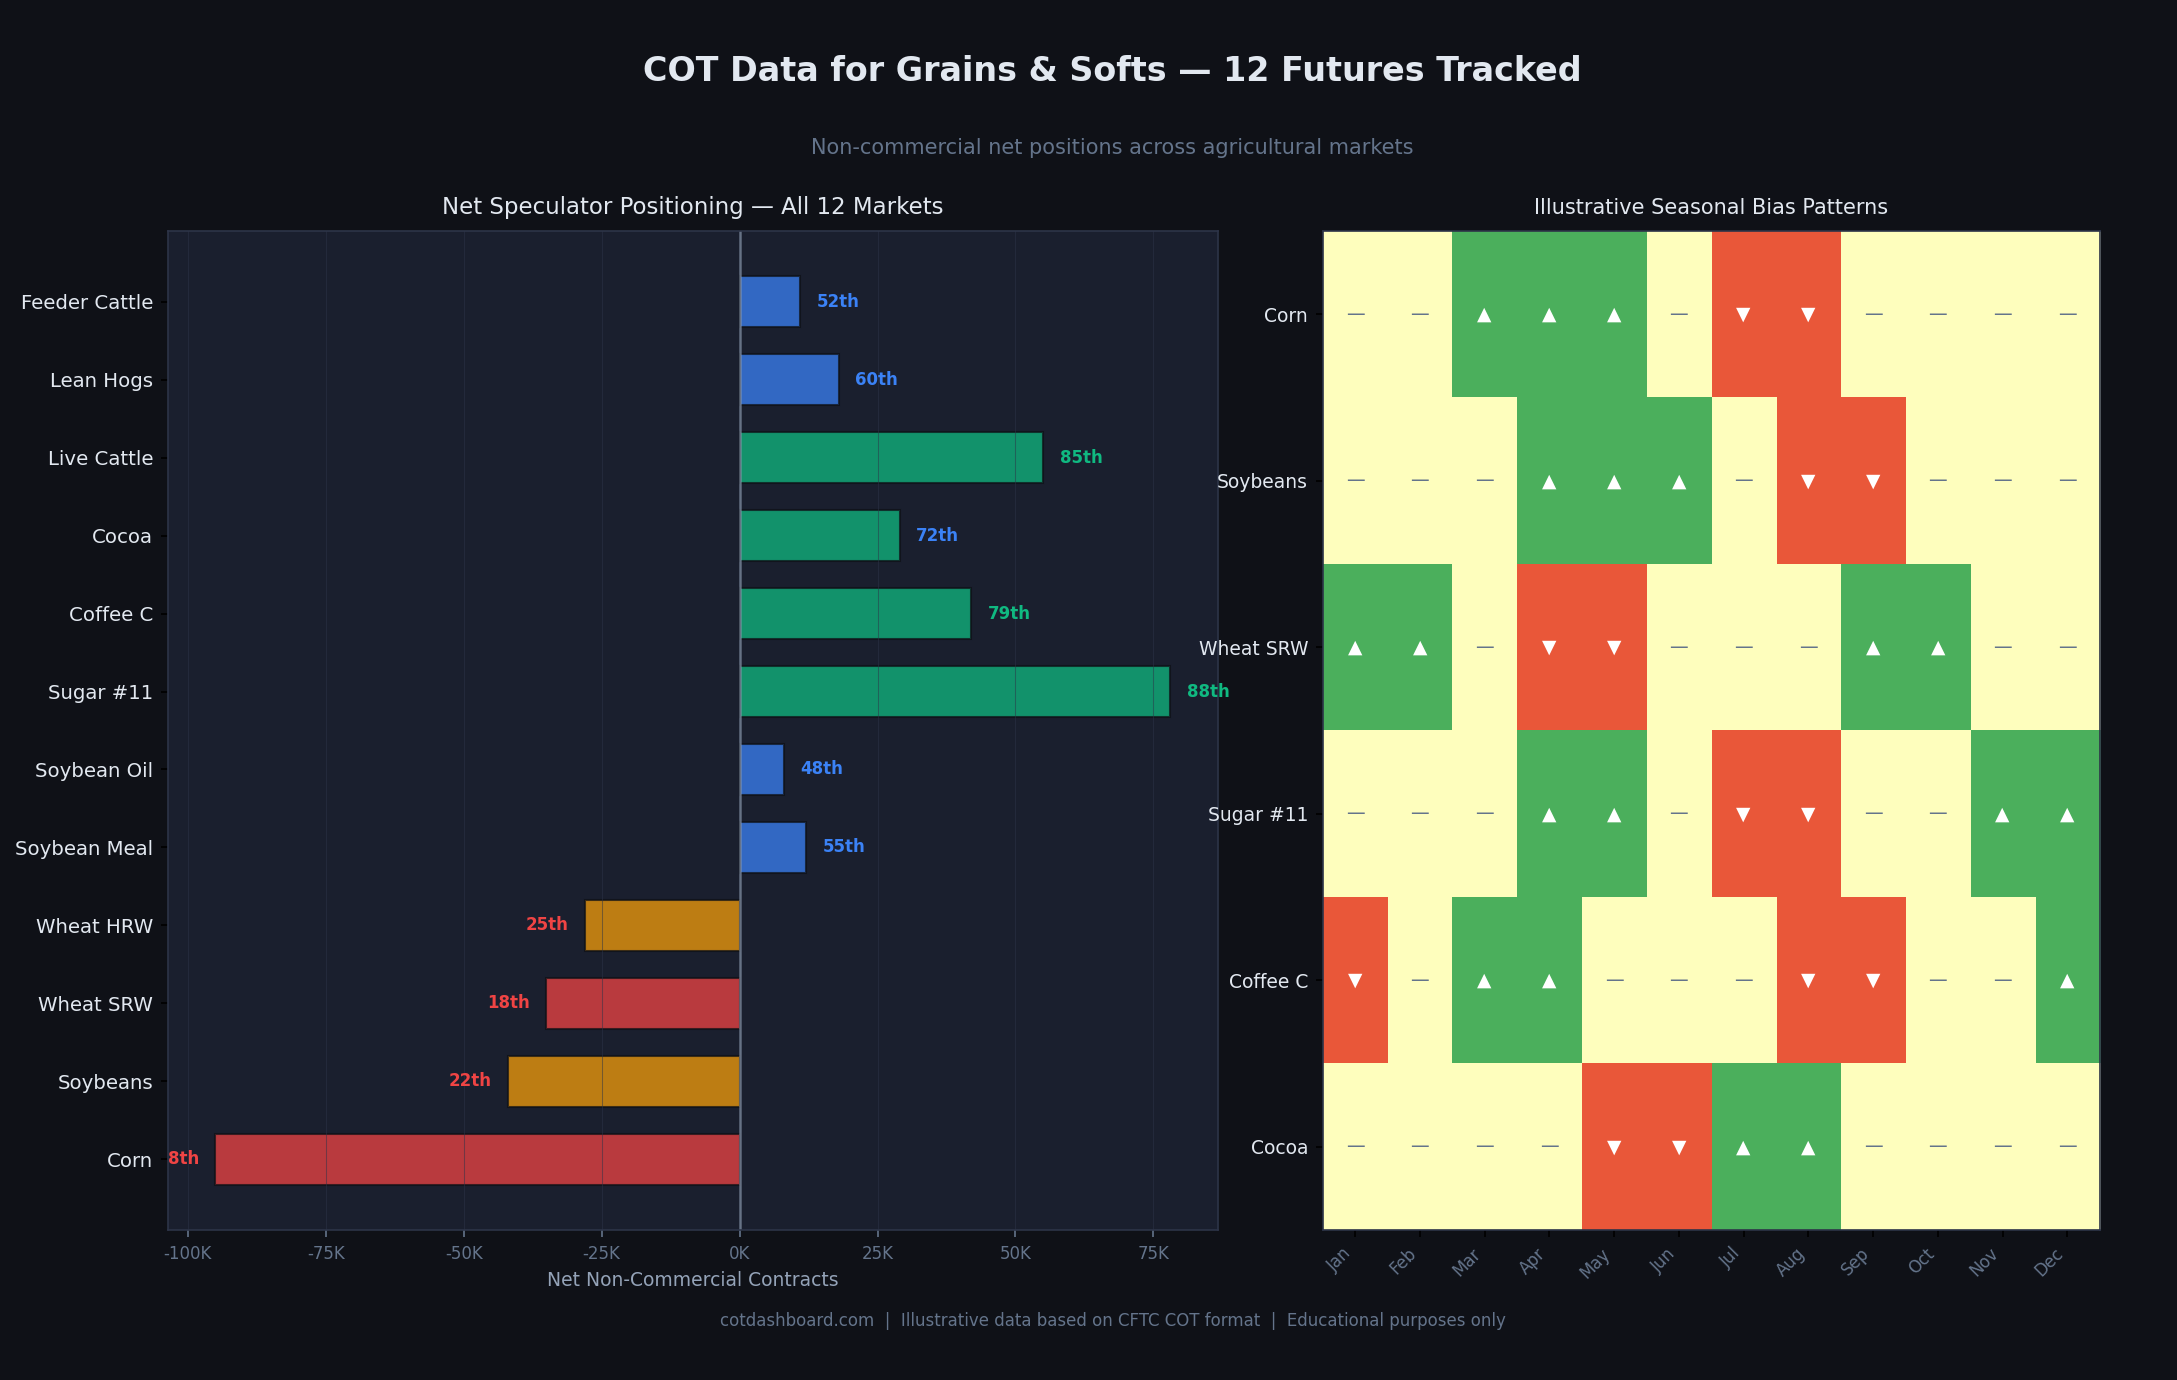
Left: current net positions for all 12 markets. Right: illustrative seasonal positioning bias patterns — green triangles suggest historically stronger net long periods, red inverted triangles suggest net short periods, dashes indicate neutral. This is a general pattern, not a forecast.
Grains: Corn, Wheat, and the Soybean Complex
Corn is the largest agricultural futures market by open interest. Net short positions in Corn are common and can be very large during periods of ample supply or weak export demand. A net short Corn position at the 5th percentile is a genuine extreme. A net short at the 30th percentile is unremarkable.
Soybeans, Soybean Meal, and Soybean Oil are closely linked — they are three products from the same crop, connected by crush margins (the spread between raw beans and processed products). When the crush margin is attractive, processors buy beans and sell meal and oil simultaneously. This can create divergent COT signals within the soybean complex that reflect processing economics rather than directional views on beans alone.
Wheat (SRW and HRW) positioning is frequently influenced by export flows and supply disruptions in major producing regions. The two wheat contracts usually move together but can diverge when quality or regional availability differs. Both are tracked separately because their positioning signals can occasionally conflict.
Softs: Sugar, Coffee, and Cocoa
The three ICE-traded softs each have distinct global supply dynamics.
Sugar #11 is driven by the Brazilian crop (the world's largest producer), monsoon patterns in India, and ethanol economics (in Brazil, sugar cane is diverted to ethanol when energy prices rise). Sugar positioning can swing dramatically around Brazilian harvest news.
Coffee C (Arabica) is sensitive to Brazilian and Colombian weather. Frosts in the Brazilian coffee belt are the classic supply shock that historically triggers rapid short-covering. Coffee positioning has shown some of the most persistent multi-year net short trends in the dataset when supply is ample, making extreme short readings worth contextualising carefully.
Cocoa supply is concentrated in West Africa, primarily Côte d'Ivoire and Ghana. Political instability or dry weather in these regions can quickly shift Cocoa COT positioning. Cocoa is also a relatively small market — net position moves of 10,000–20,000 contracts represent a meaningful percentage of total open interest.
Livestock: Cattle and Hogs
The three livestock futures (Live Cattle, Feeder Cattle, Lean Hogs) behave differently from grain and soft markets.
Live Cattle and Feeder Cattle are closely related — feeder cattle are young animals that will eventually become slaughter-weight live cattle. Their positioning tends to move together but can diverge when feed costs (driven by Corn and Soybean prices) shift the economics of feeding cattle.
Cattle positioning is more driven by domestic US consumption patterns and packing capacity than by international trade. Speculative positioning is generally less extreme in cattle than in grains, and percentile readings tend to cluster in the 30–70th range rather than reaching consistent extremes.
Lean Hogs has more volatile positioning than cattle, partly due to export demand (US pork is heavily exported to China) and partly due to disease events that can abruptly shift supply. Hog positioning can move from mid-range to extreme readings quickly following news of disease outbreaks or large US-China trade developments.
How Agricultural Positioning Reads Together
Agricultural COT data is most useful when read at the sub-group level.
Grains all at 10th percentile or below: Indicates broad pessimism about the grain complex — possibly driven by large supplies, strong harvest, or weak export demand. All three being simultaneously bearish is a stronger signal than one market in isolation.
Softs diverging: Coffee net short while Cocoa net long reflects different regional supply stories rather than a broad "soft commodities view." These markets have independent fundamentals.
Livestock versus grains aligned: When cattle and hog positioning is strong (long) but grain positioning is also long, it creates a potential tension — higher grain prices raise livestock feeding costs. This can compress meat packer margins and eventually weigh on livestock positioning.
A Note on the Weather Premium
Agricultural markets carry a "weather premium" in speculative positioning that no other asset class has to the same degree. Drought, frost, and flood risk cause traders to build long positions as insurance against supply shortfalls. This means:
- A high percentile reading may reflect genuine supply concern, not just crowded speculation
- When weather risk dissipates (e.g., a good crop condition report), speculative longs unwind rapidly
- Comparing COT extremes to the actual crop condition data is more informative than reading COT in isolation
Limitations Specific to Agricultural Markets
Seasonal adjustment is not applied. Our percentile rankings compare all historical weeks equally — a January week is ranked against other January weeks and against July weeks. Seasonal patterns mean that a 75th percentile net long in May (pre-crop concern) may be structurally normal, whereas the same reading in November (post-harvest) is more unusual.
Weather is unobservable in the data. COT data reflects positioning taken in response to weather expectations, but the expectations themselves are not visible. Positioning can look extreme purely because of a specific drought or flood event that may or may not persist.
Export demand is US-focused. US-listed grain futures reflect American export competitiveness. When the dollar strengthens, US grain exports become more expensive globally, which can suppress positioning independently of supply conditions.
Related Pages
- What Is the COT Report? — foundation reading
- How to Read COT Data — column-by-column walkthrough
- What Are Percentile Rankings? — how positions are ranked vs history
- Commercial vs Non-Commercial Traders — understanding farmers, processors, and speculators in grain markets
- Seasonal Patterns in Futures Positioning — planting, growing season, and harvest cycles explained in detail
- Do Extreme COT Positions Predict Reversals? — how reliable are extreme agricultural readings
- COT Data Limitations — weather and seasonality limitations specific to agricultural data
- Understanding COT Data for Energy Markets — another physical commodity category
- COT Glossary — key terms defined
- Interactive Dashboard — current agricultural positioning data