What Is the COT Report? A Trader's Guide to CFTC Data
Feb 10, 2026
What Is the COT Report? A Trader's Guide to CFTC Futures Positioning Data
Every Friday at 3:30 PM Eastern, the U.S. Commodity Futures Trading Commission (CFTC) publishes the Commitment of Traders report. It shows how different categories of market participants — hedgers, speculators, and small traders — are positioned across dozens of futures markets.
The data covers everything from crude oil and gold to Treasury bonds and Bitcoin. It is one of the few publicly available windows into institutional positioning.
This guide explains what the report contains, how to interpret it, and where it fits into market analysis.
What the CFTC Actually Publishes
The CFTC collects position data from large futures traders who exceed certain reporting thresholds. It then groups those traders into categories and publishes aggregate totals.
The report comes in several formats:
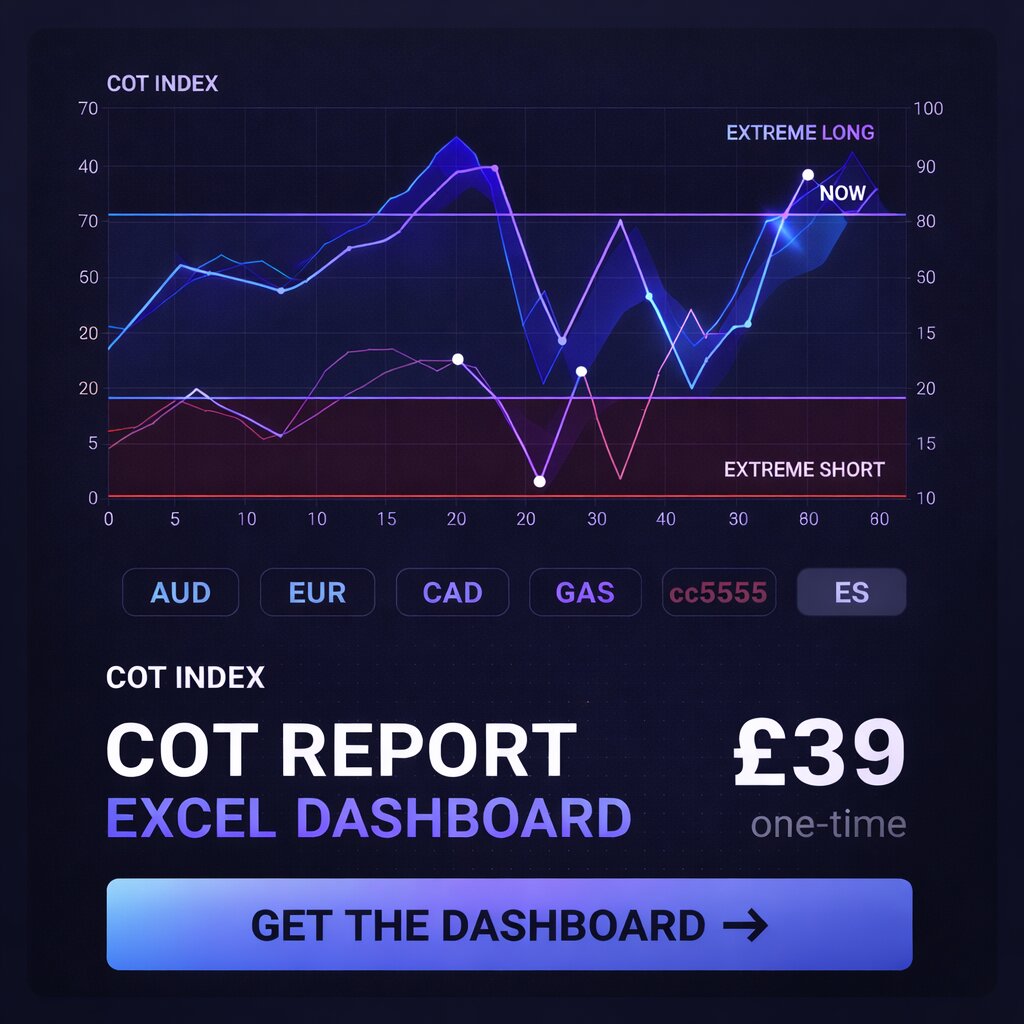
- Legacy Report — the original format. Groups traders into Commercial, Non-Commercial, and Non-Reportable. This is the most widely used version and the one we track on our dashboard.
- Disaggregated Report — breaks down Commercials into Producer/Merchant and Swap Dealers. Breaks down Non-Commercials into Managed Money and Other Reportables.
- Traders in Financial Futures (TFF) — covers financial contracts only. Uses categories like Dealer/Intermediary, Asset Manager, Leveraged Funds, and Other Reportables.
All three formats use the same underlying data. The difference is how traders get categorised.
For most analysis, the Legacy Report is sufficient. If you need to distinguish between hedge fund activity and pension fund positioning, the Disaggregated or TFF reports add that granularity.
The Three Groups in the Legacy Report
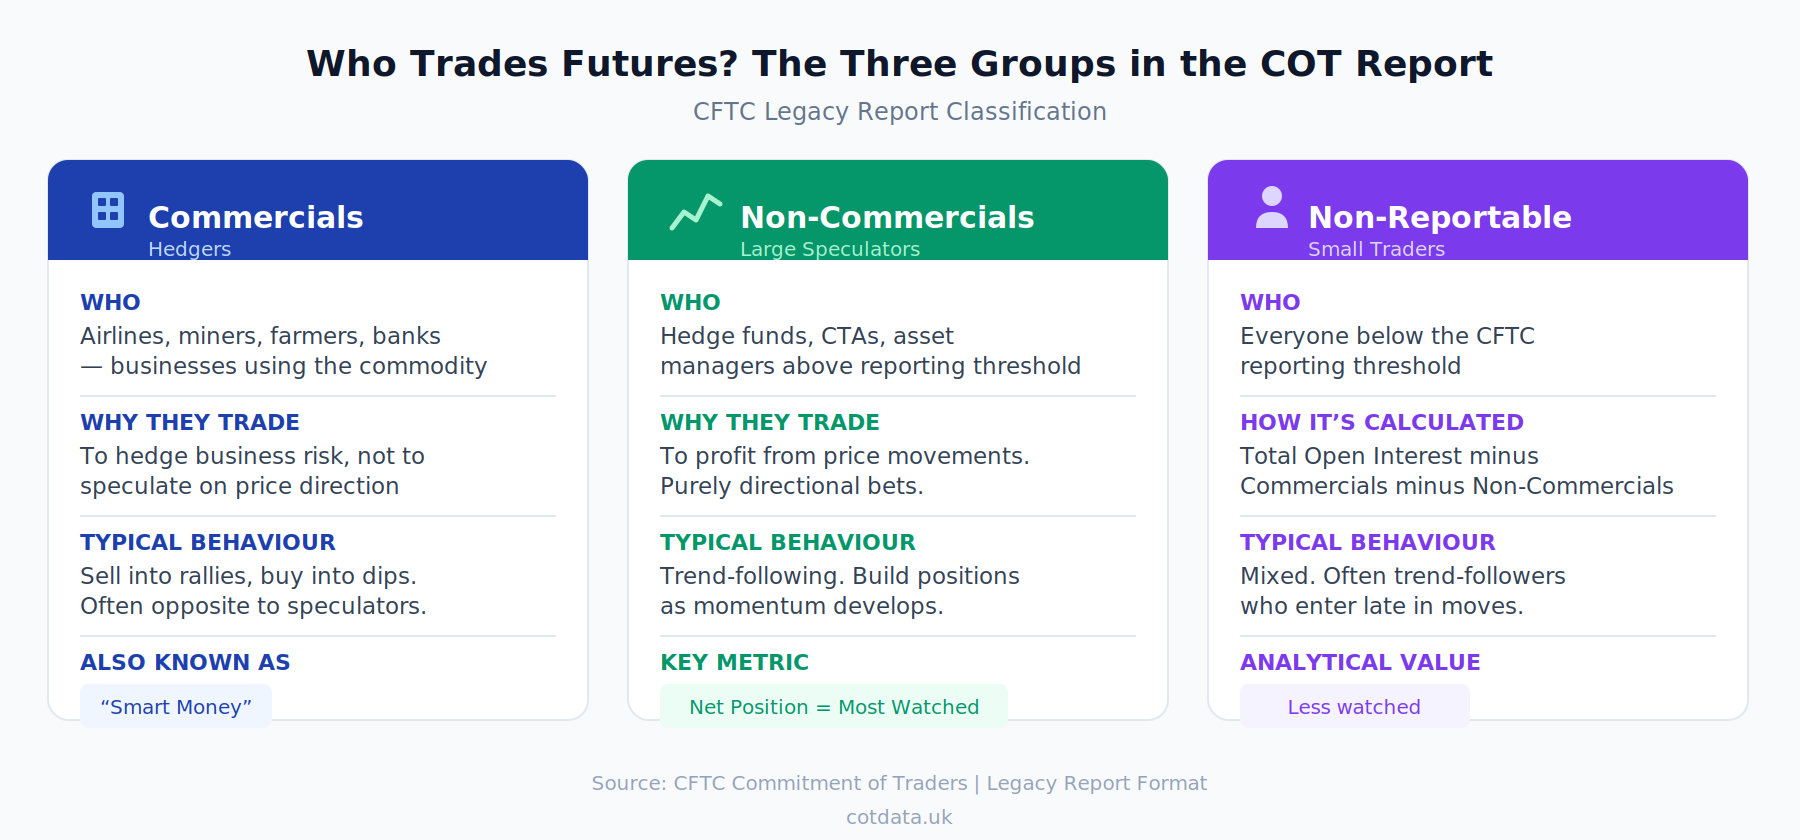
Commercials (Hedgers)
These are businesses that use the physical commodity or financial instrument in their operations. Airlines hedging jet fuel. Miners selling forward production. Banks managing interest rate exposure.
Commercials trade futures to reduce business risk, not to speculate on price direction. Their positions often run counter to the prevailing trend — they sell into rallies and buy into dips because their hedging needs are driven by business operations, not market forecasts.
They are sometimes called "smart money." That label is partly deserved: they know their own industries better than anyone. But their positioning reflects hedging needs, not directional bets.
Non-Commercials (Large Speculators)
Hedge funds. Commodity trading advisors. Asset managers. Anyone trading futures purely for profit who exceeds the CFTC's reporting threshold.
This group is directional. When non-commercial traders are heavily net long, they expect prices to rise. When net short, they expect prices to fall.
Their positioning is the most watched data point in the COT report. Extreme one-sided positioning by this group has historically preceded market turns — though "historically preceded" is doing heavy lifting in that sentence. More on limitations below.
Non-Reportable (Small Traders)
Everyone else. Traders whose positions fall below the CFTC reporting threshold. Calculated as total open interest minus the commercial and non-commercial positions.
This group tends to get less analytical attention. The conventional view is that small traders are less informed, but that generalisation has limits.
Key Terms You Need to Know
Open Interest — the total number of outstanding futures contracts in a market. Not volume (which counts trades), but the number of contracts still open. Rising open interest means new money is entering the market. Falling open interest means positions are being closed.
Net Position — long contracts minus short contracts for a given group. If non-commercials hold 150,000 longs and 80,000 shorts in gold, their net position is +70,000 (net long). This single number is what most COT analysis focuses on.
Long — a position that profits when prices rise.
Short — a position that profits when prices fall.
Reportable vs Non-Reportable — the CFTC sets position thresholds for each market. Traders above the threshold must report. Those below are lumped into "non-reportable."
What Markets Does the COT Report Cover?
The report covers futures traded on U.S. exchanges. The main categories:
- Currencies — EUR, GBP, JPY, AUD, CAD, CHF, and others
- Metals — Gold, Silver, Copper, Platinum
- Energy — Crude Oil (WTI), Natural Gas, Heating Oil, Gasoline
- Grains & Agriculture — Corn, Soybeans, Wheat, Coffee, Cocoa, Sugar, Cotton, Live Cattle, Lean Hogs
- Equity Indices — S&P 500, Nasdaq 100, Dow Jones, Russell 2000, VIX
- Interest Rates — 2-Year, 5-Year, 10-Year, and 30-Year Treasuries
- Cryptocurrency — Bitcoin and Ethereum futures (added in recent years)
We track 41 markets across these categories. You can view all of them on the interactive dashboard or download the latest data.
When Is the COT Report Released?
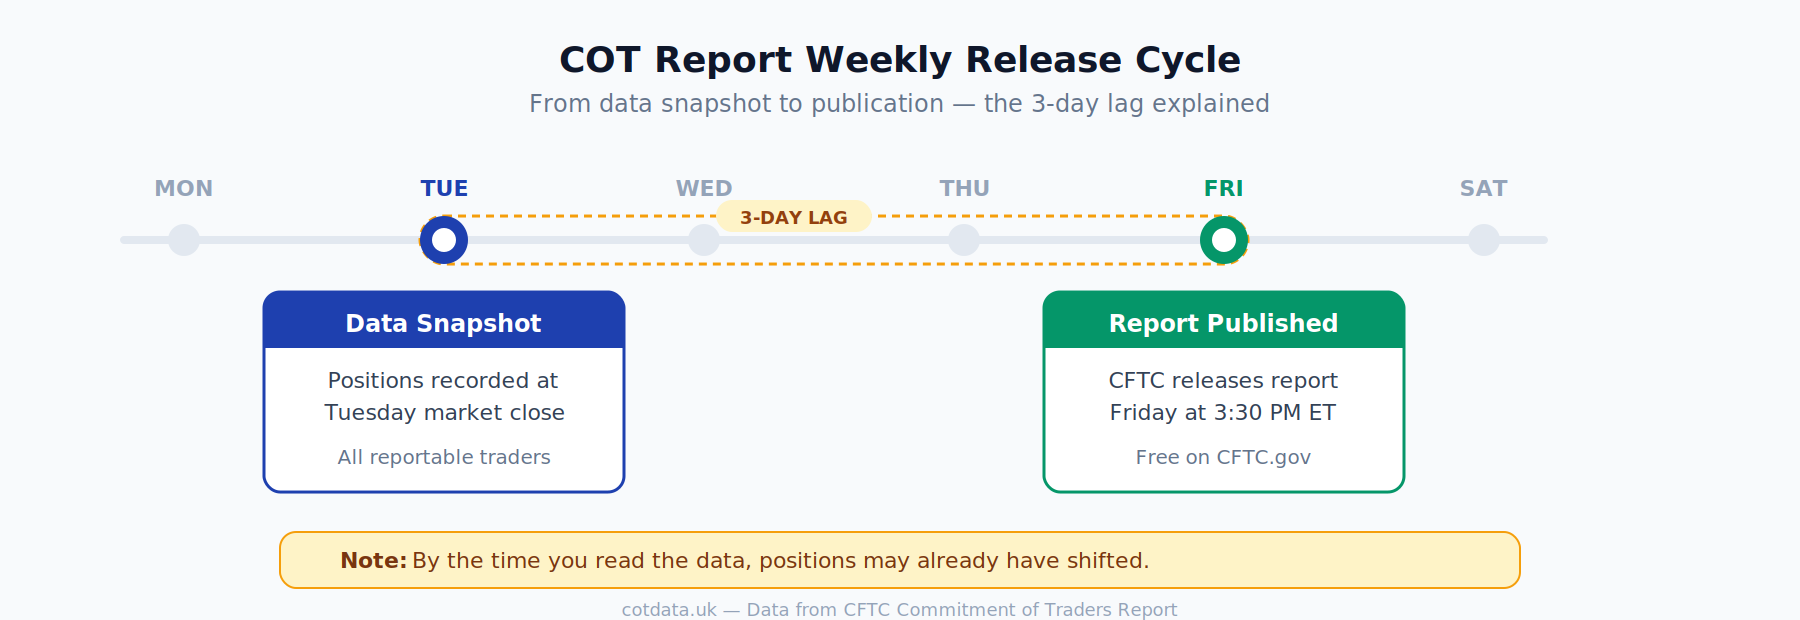
The report follows a fixed weekly schedule:
- Tuesday — the "as of" date. The data reflects positions held at market close on Tuesday.
- Friday, 3:30 PM ET — the CFTC publishes the report. There is a 3-day lag between the snapshot and the release.
This means by the time you see the data, it is already 3 days old. In fast-moving markets, positioning can shift meaningfully in that window. This lag is the single biggest limitation of COT data.
Occasionally the CFTC delays publication due to holidays. In those weeks, the report typically comes out Monday instead.
Why Traders Pay Attention to COT Data
The COT report does one thing well: it tells you where the big players are positioned right now (or rather, where they were last Tuesday).
That matters for several reasons:
Crowded trades become visible. When non-commercial traders are overwhelmingly positioned in one direction, the market becomes vulnerable to a squeeze or reversal. Not because extreme positioning causes reversals — but because there are fewer new buyers (or sellers) left to push the trend further.
Divergences stand out. If prices are making new highs but speculative net longs are shrinking, that divergence is informational. The trend may be losing conviction.
Sector-level patterns emerge. When all four Treasury maturities show extreme net short positioning simultaneously, that tells you something about broad institutional sentiment on interest rates.
It provides context. A 10,000-contract move in gold means different things depending on whether net positioning is at the 5th percentile or the 95th percentile of its historical range.
The COT report is not a timing tool. It does not tell you when to enter or exit a position. It is a positioning tool — it tells you where institutional money sits, and that context makes other analysis more informed.
Common Misconceptions
"Extreme positioning always leads to reversals"
Sometimes it does. Sometimes extreme positioning just gets more extreme. The COT report can remain at percentile extremes for weeks or months before anything happens. Treat it as a risk indicator, not a signal.
"Commercials are always right"
Commercials are hedging. Their "rightness" is incidental to their purpose. A mining company selling gold futures at $2,000 doesn't care if gold goes to $2,500 — they locked in a price they're happy with. Interpreting their positioning as a directional call is a category error.
"The 3-day lag makes the data useless"
The lag matters less than you think for longer-term positioning analysis. Institutional positions are built over weeks, not hours. A 200,000-contract net long in crude oil doesn't vanish by Friday.
"The COT report is a trading system"
It is not. It is one input among many. People who use COT data effectively combine it with price action, technical analysis, or fundamental research. The data provides context, not entry tickets.
Legacy vs. Disaggregated: Which Should You Use?
Start with Legacy. It's simpler, has a longer history, and the Commercial/Non-Commercial split captures the essential dynamic: hedgers vs speculators.
Move to Disaggregated when you need to distinguish:
- Managed Money (hedge funds) from Other Reportables (pension funds, insurance companies)
- Producers/Merchants (physical market participants) from Swap Dealers (banks running swap books)
For most markets and most purposes, the Legacy report gives you 90% of the insight. We use the Legacy format across our analysis. See our methodology page for details.
How We Use COT Data on This Site
We pull data directly from the CFTC's public API every week. Our analysis adds three layers on top of the raw numbers:
- Percentile rankings — where current positioning sits relative to the past 2 years of data. A 95th percentile reading means positioning is more extreme than 95% of the prior 104 weeks. See full methodology.
- Week-over-week changes — which markets had the biggest positioning shifts this week.
- Z-scores — how many standard deviations current positioning is from the historical mean.
All of this is available on the dashboard and discussed each week in our blog analysis.
The raw data is also downloadable as JSON: cot-latest.json.
Where to Go Next
- How to Read COT Data → — step-by-step walkthrough of reading a COT report, with examples
- Interactive Dashboard → — current positioning across 41 markets
- Weekly Analysis → — our latest COT report breakdown with percentile rankings
- Methodology → — how we calculate percentiles, Z-scores, and historical context
- CFTC Official Site → — the source data
This article is for educational purposes only. It does not constitute financial advice. COT data reflects historical positioning and does not predict future price movements. Always conduct your own research.