How to Read COT Data: Step-by-Step Guide to Commitment of Traders Report
Feb 12, 2026
How to Read COT Data: A Step-by-Step Guide to the Commitment of Traders Report
The raw CFTC Commitment of Traders report is a spreadsheet with dozens of columns and hundreds of rows. It is not designed for readability.
This guide explains how to extract the useful information, what the numbers mean, and how to put them in context. If you are new to the report itself, start with What Is the COT Report? first.
Contents
- Find the Net Position
- Check the Weekly Change
- Commercials vs Speculators
- Check Open Interest
- Put It in Historical Context
- Compare Across Markets
- A Practical Example: Gold
- What COT Data Cannot Tell You
- Does Extreme Positioning Predict Reversals?
- COT Report Release Schedule
- Tools and Downloads
- Quick Reference Table
Step 1: Find the Net Position
The single most important number in any COT report line is the net position of non-commercial traders (large speculators).
The calculation:
Net Position = Long Contracts − Short Contracts
If hedge funds hold 250,000 long contracts and 180,000 short contracts in gold, the net position is +70,000. They are "net long 70,000 contracts."
What it tells you: the directional lean of speculative money. Positive means speculators expect prices to rise. Negative means they expect prices to fall.
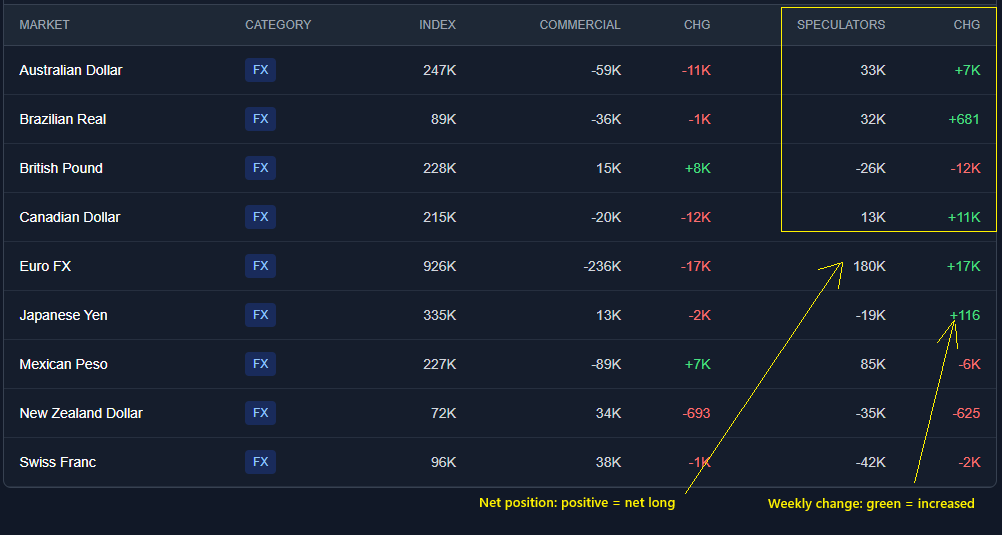
On our dashboard, this is the "Speculators" column. Green means net long. Red means net short.
Step 2: Check the Weekly Change
A static net position number is less useful than knowing which direction it is moving.
The CFTC provides weekly change data for each trader category. If gold net longs went from +70,000 last week to +85,000 this week, speculators added 15,000 contracts of net long exposure.
What to watch for:
- Large weekly changes relative to the market's normal range. A 5,000-contract move in natural gas is routine. A 50,000-contract move is not.
- Direction of change vs. price direction. If crude oil prices fell this week but speculators added longs, that is a divergence worth noting.
- Consecutive weeks in the same direction. Three or more weeks of steady long-building (or short-building) suggests a developing trend in positioning, not just noise.
On our dashboard, the "CHG" column shows the weekly change. Green for increases, red for decreases.
Step 3: Look at Both Sides — Commercials vs Speculators
Commercials (hedgers) and non-commercials (speculators) usually take opposite sides of the market. This is structural — commercials are hedging the risk that speculators are taking on.
The typical dynamic:
When speculators are heavily net long, commercials are heavily net short. Speculators are betting prices will rise. Commercials are locking in current prices to protect their business.
When this relationship breaks down, pay attention. If both groups are moving in the same direction, something unusual is happening. It could indicate a fundamental shift in supply/demand dynamics, or one group unwinding hedges.
Common analytical framework:
- Commercials net short + Speculators net long = normal positioning. Speculators are driving the bullish side.
- Commercials moving toward neutral while speculators are at extremes = the "smart money" may be stepping aside.
- Both groups reducing positions simultaneously = falling open interest, which often precedes consolidation.
Step 4: Check Open Interest
Open interest is the total number of outstanding contracts in a market. It shows how much capital is committed.
Three patterns to know:
Rising price + rising open interest = new money entering in the direction of the trend. The move has conviction.
Rising price + falling open interest = short covering. Prices are rising because shorts are exiting, not because new buyers are entering. The rally may be less durable.
Extreme net positioning + high open interest = a crowded trade. Many participants are on the same side. This creates conditions for a sharp reversal if the trade starts to unwind.
On our dashboard, open interest is shown in the "Index" column.
Step 5: Put It in Historical Context
A net long position of 70,000 contracts in gold means nothing in isolation. Is that high? Low? Average?
This is where percentile rankings matter.
If the current net long is at the 95th percentile of the past 2 years, positioning is more extreme than 95% of the prior 104 weekly readings. That is a crowded trade.
If it is at the 30th percentile, it is unremarkable.
How percentiles work on our site:
We rank the current net position against every weekly reading in our COT report historical data. A 99th percentile reading means the position is near its highest. A 1st percentile reading means it is near its lowest.
Percentiles above 90 or below 10 are flagged as "near extremes" in our weekly COT report analysis. These are the data points worth the most attention.
Z-scores add another layer. A Z-score tells you how many standard deviations the current position is from the historical average. A Z-score of +2.0 means the position is two standard deviations above the mean — statistically unusual. Below −2.0 is equally unusual on the short side.
Full calculation details are on our methodology page.
Step 6: Compare Across Markets
Reading one market in isolation misses the broader picture. Some of the most useful COT analysis comes from comparing positioning across related markets.
Examples:
Treasury complex. If 2-year, 5-year, 10-year, and 30-year Treasuries all show extreme net short positioning, that is a broad institutional bet on higher interest rates. If only the long end is short while the short end is neutral, speculators are betting on a steeper yield curve.
Currency markets. When speculators are net long USD against most major currencies simultaneously, that is a consensus dollar-bullish trade. Mixed positioning — long vs. EUR but short vs. JPY — gives a more nuanced picture.
Energy sector. Crude, natural gas, heating oil, and gasoline often move together, but not always. Divergences can reflect seasonal factors, supply disruptions, or refining margin trades.
Metals. Gold and silver usually move directionally together, but the magnitude often differs. Silver positioning tends to be more volatile and more speculative.
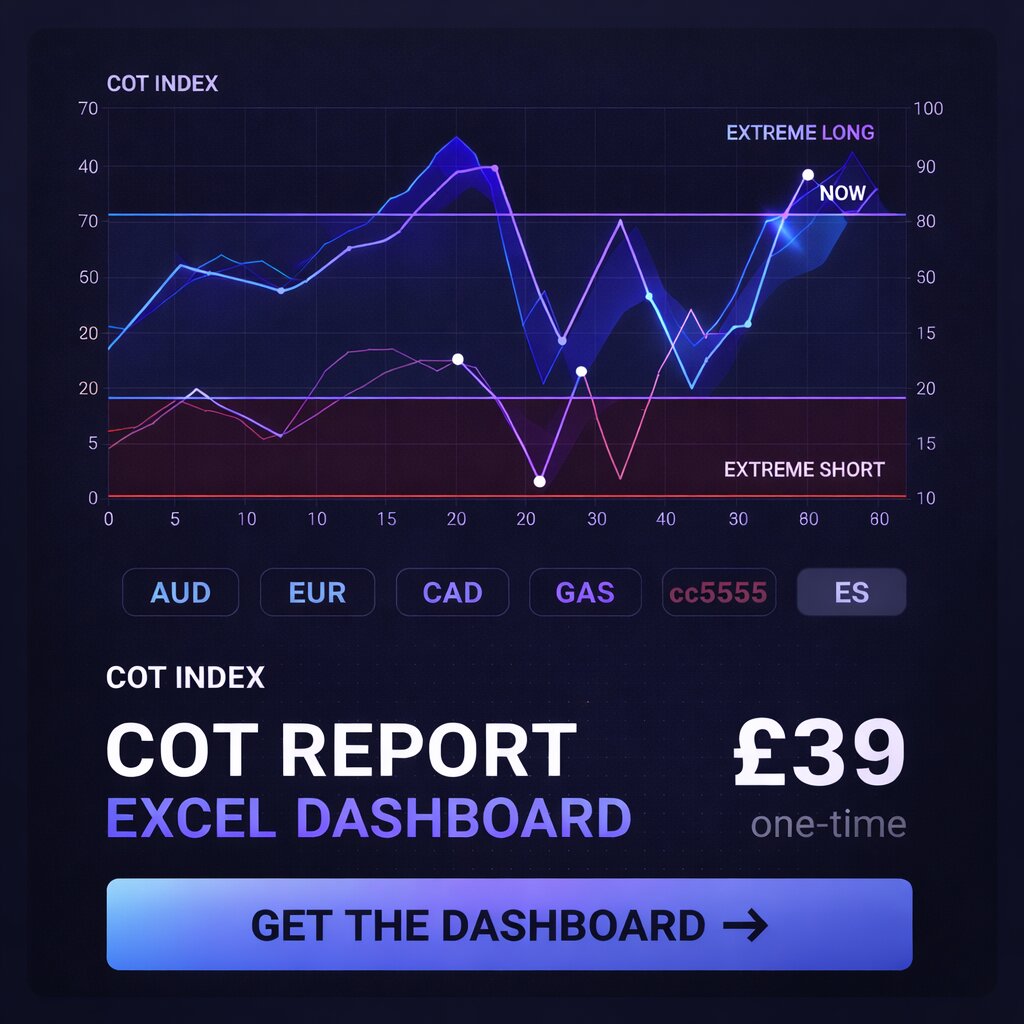
The dashboard filter buttons let you isolate one sector at a time.
A Practical Example: Reading Gold
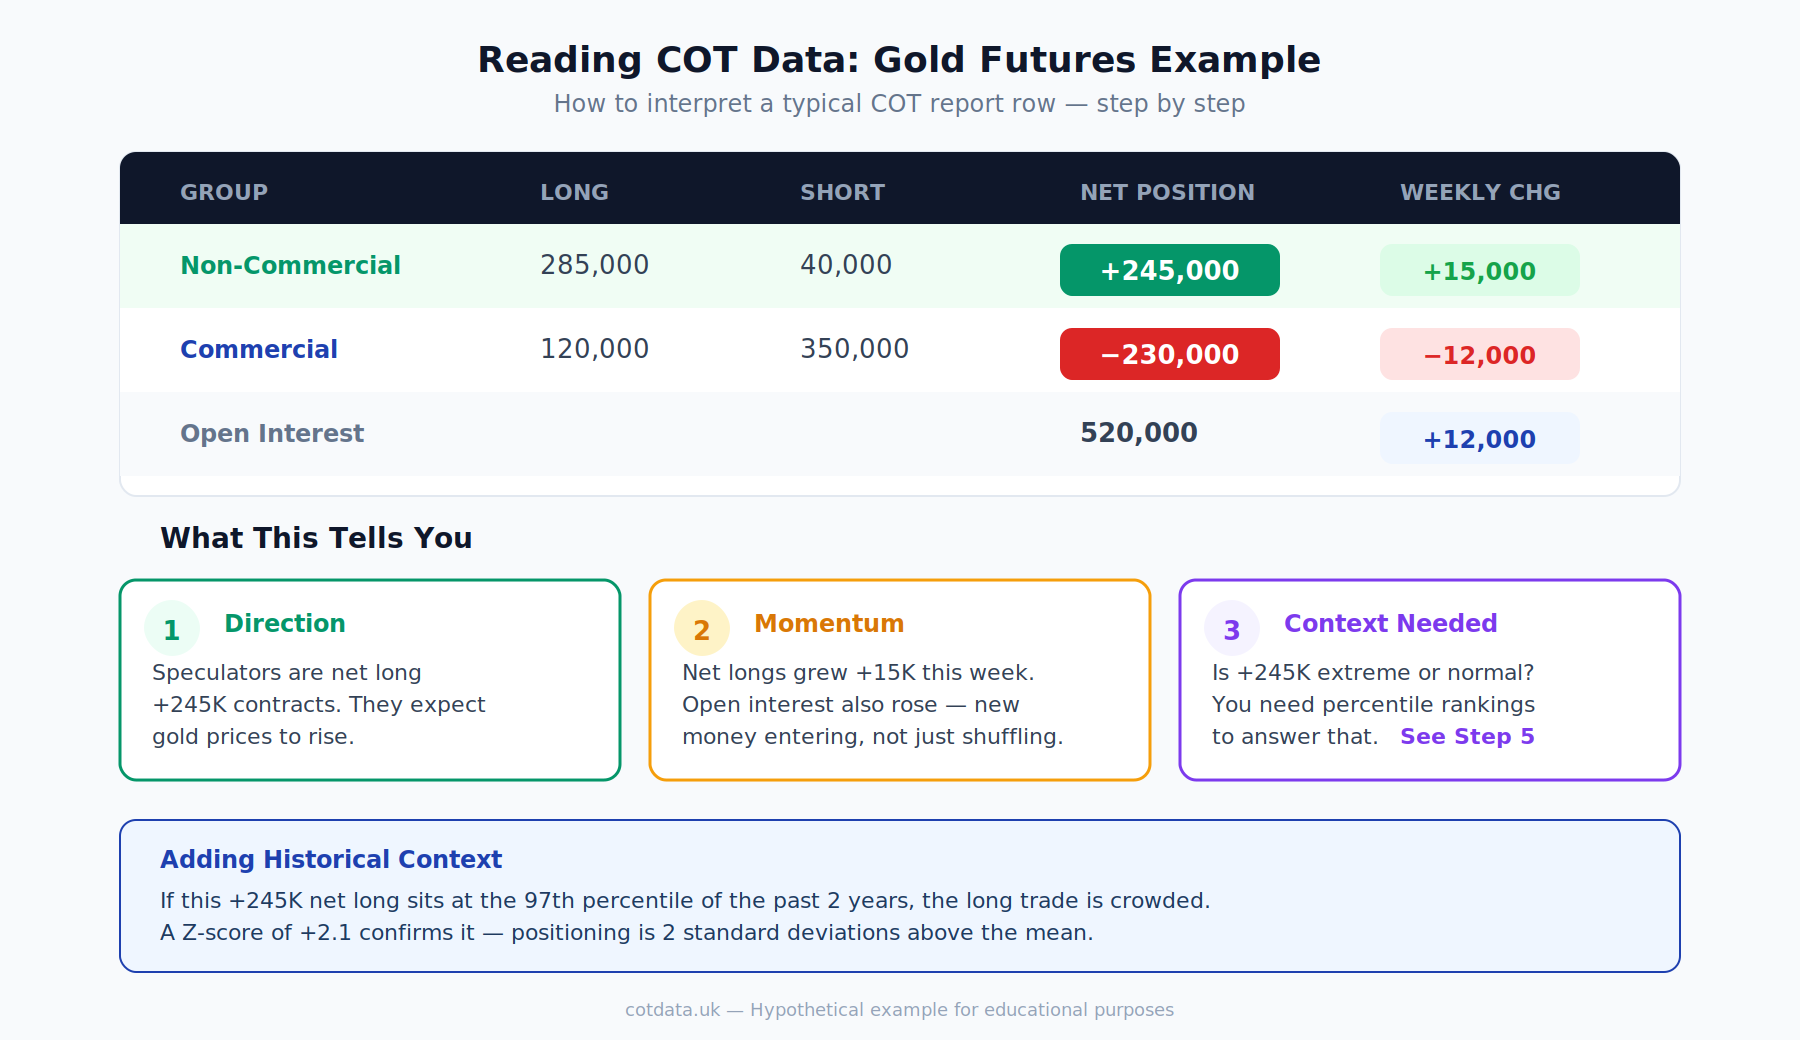
The raw numbers:
| Group | Long | Short | Net |
|---|---|---|---|
| Non-Commercial | 285,000 | 40,000 | +245,000 |
| Commercial | 120,000 | 350,000 | -230,000 |
| Open Interest | — | — | 520,000 |
What you extract:
- Speculators are heavily net long (+245,000). They expect gold prices to rise.
- Commercials are heavily net short (-230,000). They are hedging — miners locking in prices, banks offsetting swap exposure.
- The two sides roughly offset, which is normal.
Now add context:
- This week's net long is +245,000. Last week it was +230,000. Speculators added 15,000 net longs.
- The 2-year percentile for this net long is 97th. Near the most bullish speculative positioning in 2 years.
- The Z-score is +2.1. More than 2 standard deviations above the mean.
- Open interest rose by 12,000 contracts. New money entered the market.
The interpretation:
Speculative positioning in gold is at a 2-year extreme and still building. This does not mean gold will reverse. It means the long trade is crowded, and any catalyst — unexpected dollar strength, a shift in rate expectations — could trigger rapid unwinding.
That is not a trade signal. It is context that makes every other piece of gold analysis more informed.
What COT Data Cannot Tell You
Timing. Extreme positioning can persist for weeks or months. A 99th percentile reading does not mean a reversal is imminent. It means the trade is crowded. Those are different statements.
Causation. The COT report shows correlation at best. Speculators piling into longs reflects that they already expect prices to rise. By the time the data is published, the positions are 3 days old.
Intraday or short-term moves. The data is weekly. It tells you nothing about what happened on Wednesday afternoon.
Options positioning. The standard COT report covers futures only. Options positioning is not included in the Legacy format.
Why positions were taken. A net short in Treasuries could be a directional bet on higher rates, a hedge against a bond portfolio, or a relative value trade. The report does not distinguish intent.
Does Extreme COT Positioning Predict Reversals?
The honest answer: sometimes, but not reliably enough to use as a standalone indicator.
Academic research and backtesting show that extreme speculative positioning has some predictive value for subsequent returns — particularly at the tails (above 90th or below 10th percentile). But the effect is probabilistic, not deterministic.
What extreme positioning does reliably is identify asymmetry. When everyone is long, the upside is limited (who is left to buy?) and the downside is amplified (a lot of positions to unwind). The reverse holds for extreme shorts.
This is why COT data functions as a contrarian indicator in many analytical frameworks — not as a standalone system, but as a filter that adjusts risk assessment. It is context, not signal.
COT Report Release Schedule
The CFTC publishes the Commitment of Traders report on a fixed weekly schedule.
- Data snapshot: Every Tuesday at market close
- Publication date: Every Friday at 3:30 PM Eastern
- Lag: 3 calendar days between snapshot and publication
- Holiday schedule: If Monday is a U.S. federal holiday, publication is sometimes delayed to the following Monday
- Official source: CFTC.gov
We publish our weekly COT report analysis every Friday after the 3:30 PM release. The latest breakdown is always at /blog.
Tools for Reading COT Data
Raw CFTC data. The CFTC publishes reports in text and Excel format on their website. Functional but not user-friendly for quick analysis.
Our dashboard. We parse the raw CFTC data weekly and display it with category filters, weekly changes, and open interest. Available at /dashboard.
Weekly analysis. Every Friday we publish a quantitative COT report breakdown with percentile rankings and Z-scores across all 41 markets. Available at /blog.
COT report download. We publish the processed data as JSON for anyone who wants to run their own analysis: cot-latest.json. Updated every Friday after the CFTC release.
COT report historical data. Our full history file covers up to 104 weeks of weekly readings per market. Download at cot-history.json. Useful for backtesting or building your own percentile calculations.
Third-party tools. TradingView has a built-in COT indicator. Some futures brokerages include COT overlays in their platforms. We do not endorse specific third-party tools.
Quick Reference: Reading a COT Data Row
| Column | What It Means | What to Watch |
|---|---|---|
| Market | The futures contract (e.g., Gold, Crude Oil) | — |
| Category | Asset class (FX, Metals, Energy, etc.) | Compare within categories |
| Open Interest (Index) | Total outstanding contracts | Rising = new money. Falling = closing positions |
| Commercial Net | Hedger positioning (long − short) | Usually opposite to speculators |
| Commercial CHG | Week-over-week change in commercial net | Shifts in hedging activity |
| Speculator Net | Large speculator positioning (long − short) | The key number. Direction of speculative money |
| Speculator CHG | Week-over-week change in speculator net | Large changes = conviction shifting |
Summary
Reading COT data comes down to a repeatable six-step process:
- Check the net position — which way are speculators leaning?
- Check the weekly change — is that lean increasing or decreasing?
- Compare commercials vs speculators — is the normal dynamic intact?
- Check open interest — is money flowing in or out?
- Add historical context — percentiles and Z-scores show if positioning is extreme
- Compare across markets — sector-level patterns often matter more than individual markets
None of these steps produce a trade signal. All of them produce better-informed analysis.
Further Reading
- What Is the COT Report? → — overview of the report, its history, and the three trader groups
- Weekly COT Report Analysis → — latest breakdown with percentile rankings across 41 markets
- Interactive Dashboard → — current positioning with category filters
- Methodology → — how we calculate percentiles, Z-scores, and historical averages
- Download COT Data → — processed JSON, updated every Friday
This guide is for educational purposes only and does not constitute financial advice. COT data reflects historical positioning and should not be used as the sole basis for trading decisions. Always conduct your own research.