Understanding COT Data for Energy Markets
Feb 13, 2026
Energy futures are the highest open-interest commodity category in the CFTC report. Crude Oil WTI alone routinely shows more open contracts than any other physical commodity future. This makes energy COT data statistically robust but also subject to large absolute swings that can look dramatic in isolation.
This guide covers the five energy markets we track, their relationship to one another, and the positioning patterns worth understanding.
The Five Energy Markets We Track
| Symbol | Market | CFTC Code | Contract Size | Exchange |
|---|---|---|---|---|
| CL | Crude Oil WTI | 067651 | 1,000 barrels | NYMEX |
| NG | Natural Gas | 023651 | 10,000 MMBtu | NYMEX |
| HO | Heating Oil | 022651 | 42,000 gallons | NYMEX |
| RB | Gasoline RBOB | 111659 | 42,000 gallons | NYMEX |
| EH | Ethanol | 025651 | 29,000 gallons | CBOT |
Crude Oil and Natural Gas are the two most widely followed. Heating Oil and Gasoline RBOB are petroleum products derived from crude — their positioning often moves with Crude Oil but can diverge based on refining margins and seasonal demand. Ethanol has much lower open interest and is the least institutionally followed of the five.
Crude Oil WTI: The Most-Watched Energy Position
Crude Oil positioning is monitored closely because it reflects broad macro sentiment around global growth, geopolitical risk, and OPEC supply expectations. A few structural points:
The commercial side is massive. Oil producers, refiners, and airlines are constant hedgers in this market. Commercial short positions (producers locking in future sale prices) are typically very large. The non-commercial net position floats around this commercial anchor.
Speculative positioning can swing 100,000+ contracts in a few weeks. This is normal for Crude Oil given its liquidity. A large absolute change is less notable here than the same change in a smaller market like Platinum or Ethanol.
Geopolitical events cause abrupt positioning shifts. Supply disruption concerns can cause rapid speculative long-building that looks extreme in percentile terms but is driven by event-specific factors rather than pure macro consensus.
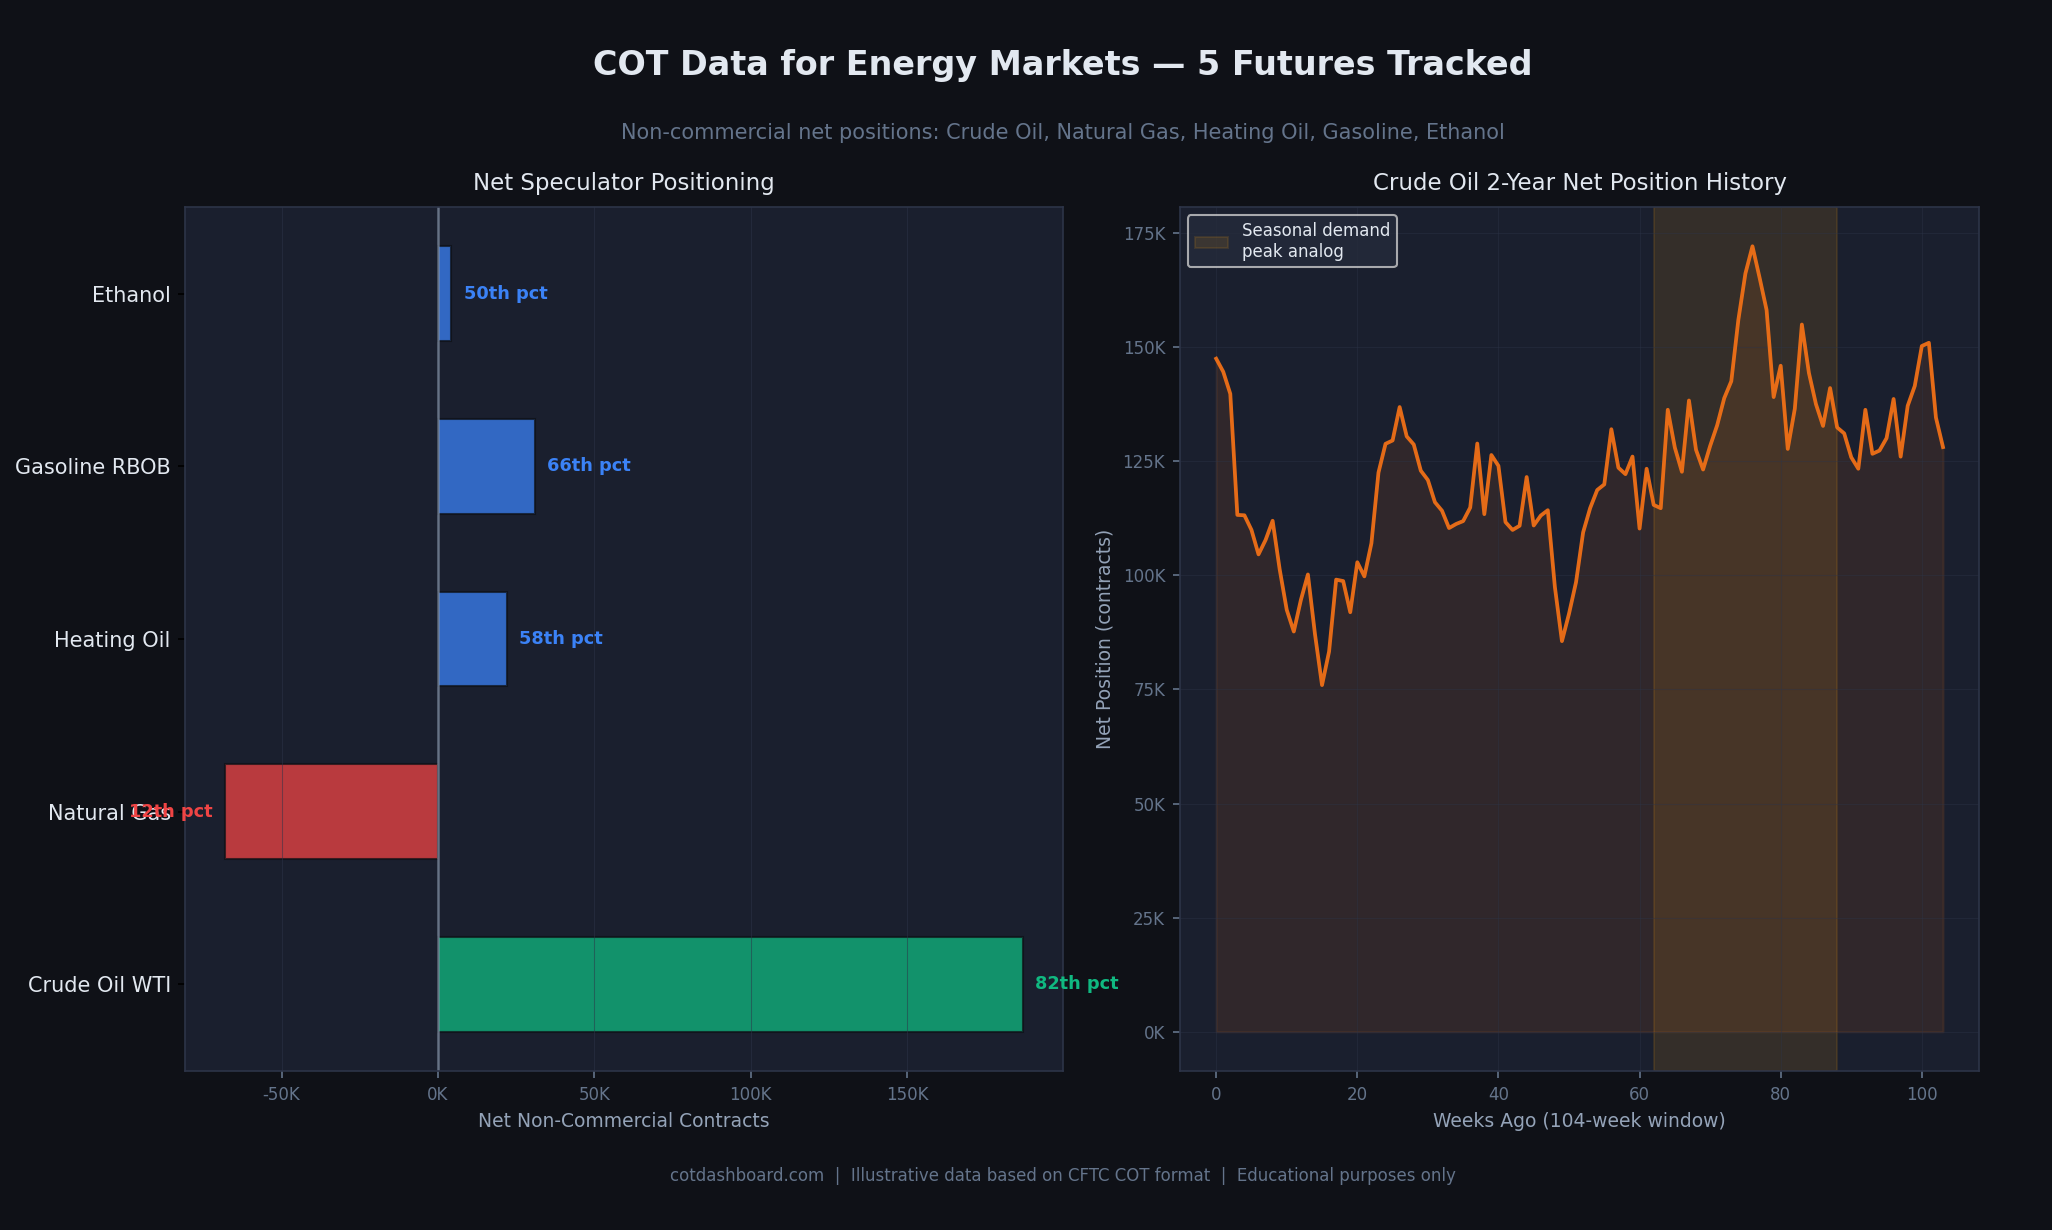
Left: current net positions across all five energy markets. Right: Crude Oil two-year positioning history. The shaded region illustrates an example of how seasonal demand periods can correlate with positioning trends.
Natural Gas: Opposite to Crude, Driven by Weather
Natural Gas positioning behaves quite differently from crude oil. Its demand is dominated by heating and cooling — it has strong seasonal patterns that make it one of the most cyclically predictable futures markets in COT terms.
Key seasonal pattern: Speculative Net Long positions in Natural Gas tend to build heading into Northern Hemisphere winter (October–January) and then unwind in spring. This is not a rule but a recurring tendency worth knowing.
Net short is common and not unusual. Unlike Gold or Crude, Natural Gas frequently shows non-commercial positioning in net short territory. Trend-following funds often build short positions when prices are weak or storage levels are high. A 12th percentile reading in Natural Gas is less alarming in context than a similar reading in Gold.
Weather shocks drive reversals. An unexpected cold snap or summer heat wave can cause very rapid short covering. This is one of the markets where extreme net short readings have historically unwound quickly on weather surprises.
Heating Oil and Gasoline RBOB: Petroleum Products
Heating Oil and Gasoline RBOB are both refined products derived from crude oil. Their positioning generally correlates with Crude Oil, but divergences occur when refinery margins (the "crack spread") are unusually wide or narrow.
Heating Oil has the stronger seasonal component — demand peaks in autumn and winter for space heating. Speculative positioning tends to build before the heating season and fade after it.
Gasoline RBOB demand peaks in the North American driving season (May–September). This "summer driving season" effect creates a mild seasonal positioning pattern where speculative longs build in Q1–Q2 anticipation and unwind in Q3.
When Heating Oil and Gasoline positioning diverge sharply from each other — or from Crude Oil — it is a sign that something specific is happening in refining capacity or product inventories rather than in raw oil supply.
Reading the Full Energy Complex
The most useful reading of energy COT data looks at all five markets together:
Aligned positioning (all five directionally similar): Reflects a consistent macro view on global energy demand or supply. This is the normal state — the five markets tend to move together.
Crude Oil and Natural Gas diverging: Not unusual, since natural gas has independent supply and weather dynamics. Divergence here requires no special explanation.
Heating Oil and Gasoline diverging from Crude: More notable. Could indicate a refinery-specific development, a product inventory imbalance, or a regional demand story.
Ethanol moving independently: Ethanol positioning is tied to corn prices (ethanol is produced from corn in the US) and government biofuel mandates. Its positioning can move on agricultural news rather than energy market developments.
Limitations Specific to Energy Markets
OPEC and government policy are not captured. When OPEC announces a production cut, speculative positioning shifts rapidly. The COT data shows the result of that shift, not the cause. It is a lagging reflection of how traders are positioned after digesting the news.
Crude Oil is a global commodity; the futures are US-specific. WTI futures reflect the oil price at Cushing, Oklahoma — a single delivery point. Global Brent crude (not tracked here) can diverge from WTI based on North American storage and pipeline dynamics. The speculative positioning in WTI does not fully represent global oil sentiment.
High absolute open interest inflates the appearance of extremes. Crude Oil regularly shows net positions in the 200,000–400,000 range. These numbers look large next to smaller markets but are normal for this asset class. Always compare against the percentile rank, not the raw contract count.
Related Pages
- What Is the COT Report? — foundation reading
- How to Read COT Data — column-by-column walkthrough
- What Are Percentile Rankings? — how positions are ranked vs history
- Commercial vs Non-Commercial Traders — understanding hedgers (producers, refiners) vs speculators in energy
- Seasonal Patterns in Futures Positioning — driving season and heating season cycles explained
- Do Extreme COT Positions Predict Reversals? — how to read extreme crude oil readings
- COT Data Limitations — what the weekly data cannot tell you
- Understanding COT Data for Metals Markets — another physical commodity category
- COT Glossary — key terms defined
- Interactive Dashboard — current energy positioning data