Understanding COT Data for Metals Markets
Feb 15, 2026
Metals futures are among the most closely watched categories in the COT report. Gold in particular routinely generates the most extreme percentile readings of any market in the dataset — it is not unusual for speculative positioning to reach 95th percentile or above during periods of macro stress.
This guide covers the four metals futures we track, how they differ from one another, and how to interpret positioning data in this category.
The Four Metals We Track
All four are COMEX or NYMEX-listed futures. Contract specifications vary significantly, which matters when comparing absolute net position numbers.
| Symbol | Market | CFTC Code | Contract Size | Exchange |
|---|---|---|---|---|
| GC | Gold | 088691 | 100 troy oz | COMEX |
| SI | Silver | 084691 | 5,000 troy oz | COMEX |
| HG | Copper | 085692 | 25,000 lbs | COMEX |
| PL | Platinum | 076651 | 50 troy oz | NYMEX |
Gold has by far the largest open interest and is the most liquid. Platinum is the smallest of the four and can show thinner positioning data.
Precious vs Industrial: A Key Distinction
The four metals split into two groups with different positioning drivers.
Precious metals (Gold, Silver) attract speculative positioning primarily based on:
- Macro and monetary policy expectations (real interest rates, dollar direction)
- Inflation and safe-haven demand
- Risk-off events and geopolitical stress
Industrial metals (Copper, and to a degree Platinum) attract positioning based on:
- Global growth expectations
- Manufacturing and construction activity
- Supply disruption risk
This means Gold and Copper can move in opposite directions even within the same week. A strong US jobs report might push Gold positioning lower (higher rates = less appeal) while supporting Copper positioning (growth = more demand).
Reading both precious and industrial metals positioning together provides more information than reading either in isolation.
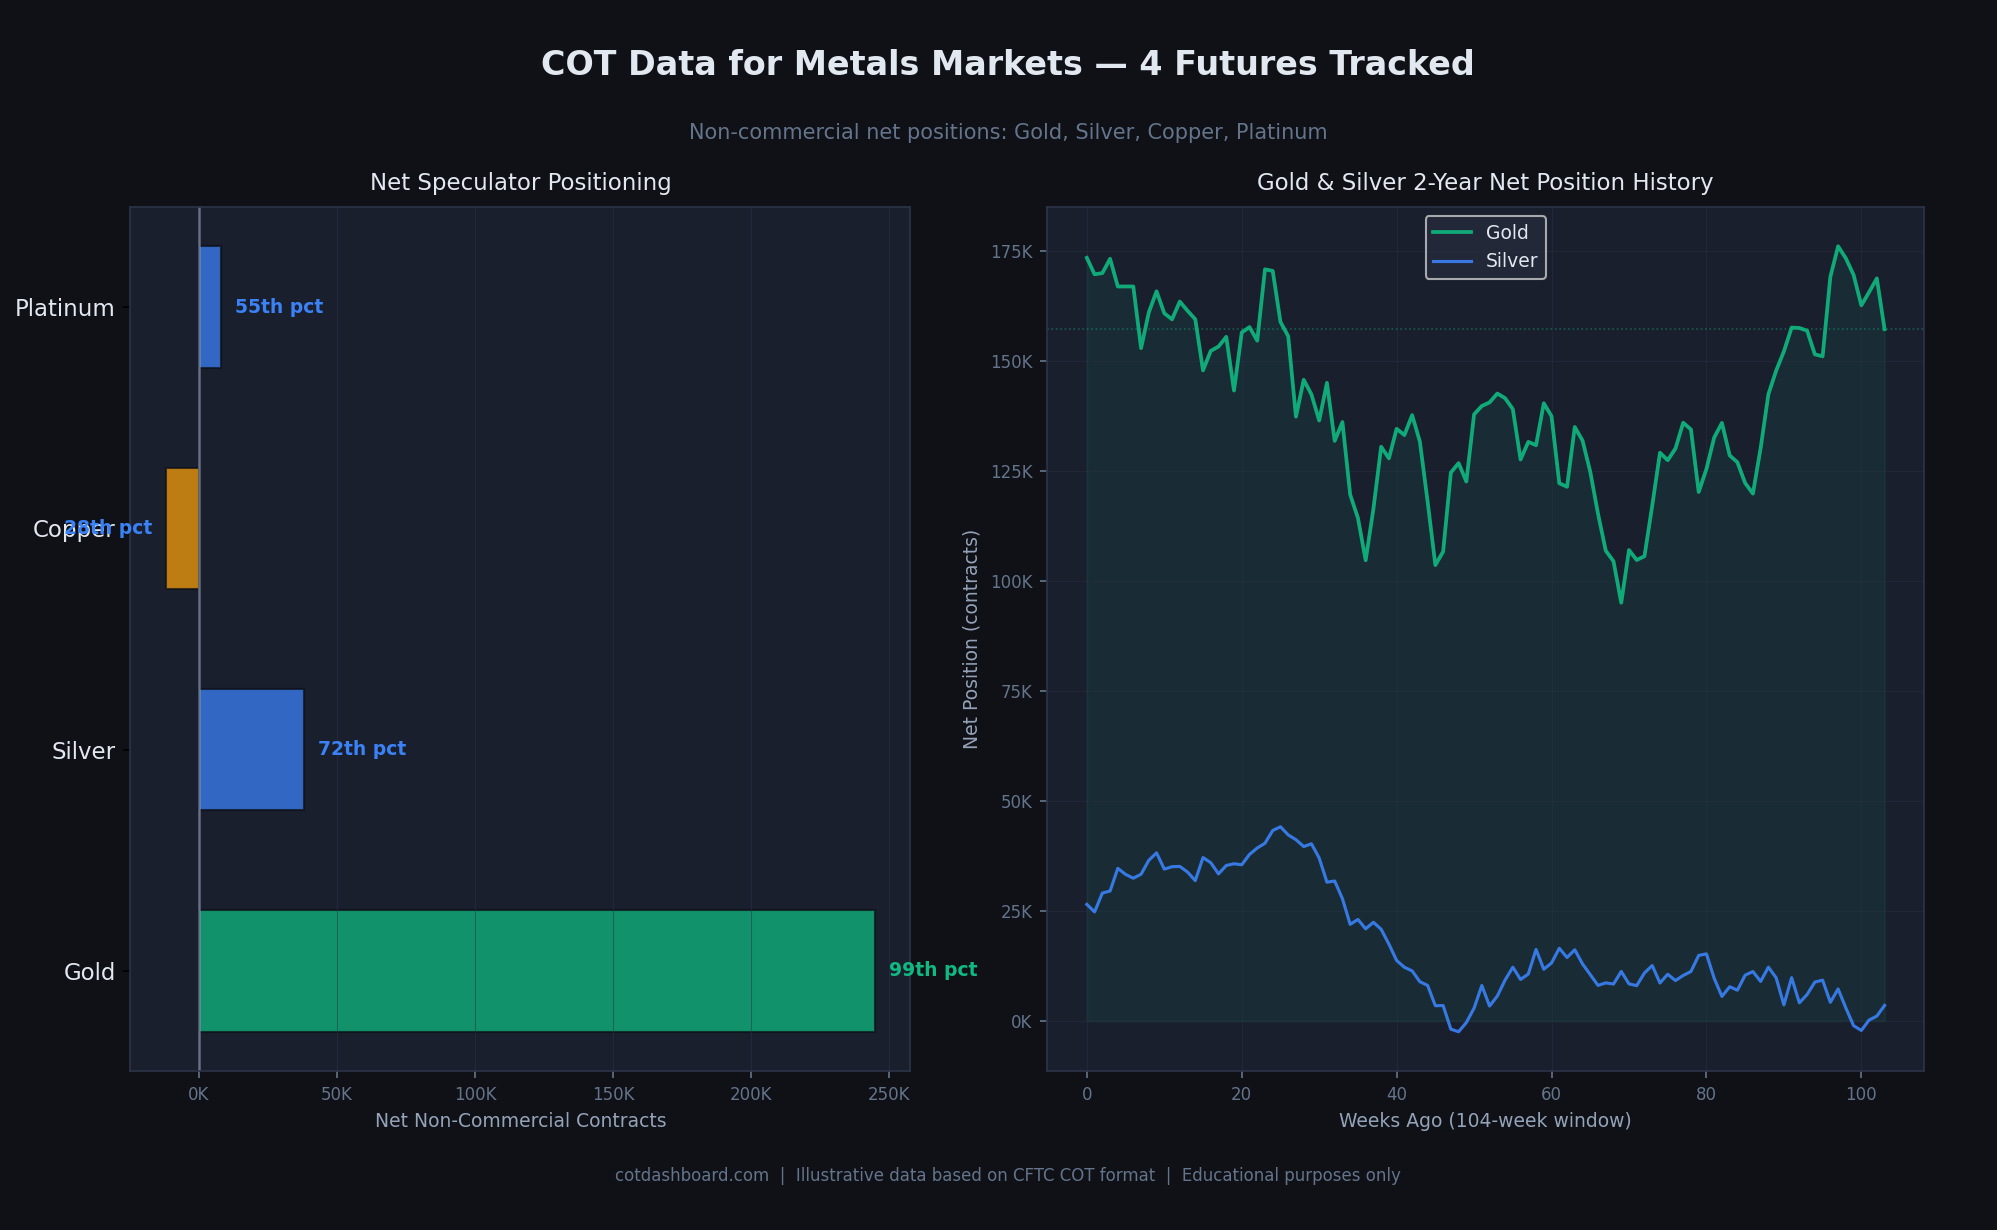
Left: current net positions with percentile ranks. Right: 104-week position history for Gold and Silver, showing how positioning trends over a full cycle.
Gold: The Benchmark Metals Position
Gold is the highest-volume precious metals future and the one most watched by macro analysts. Its COT positioning has a few well-documented characteristics:
Large absolute swings. Gold net long positions can range from near zero to over 300,000 contracts across a full cycle. This is a wide range, and context matters.
Strong correlation with real yields. When US real interest rates (nominal yields minus inflation expectations) fall, speculative Gold longs tend to build. When real rates rise, they tend to unwind. This is not a rule, but a pattern worth knowing.
Crowding risk at extremes. When Gold positioning reaches 95th percentile or above, it indicates that speculative participation is near its historical peak. This does not mean a reversal is imminent, but it does mean there are fewer new buyers to push the position higher.
Silver: High Volatility, Smaller Base
Silver positioning moves directionally with Gold, but the base of open interest is smaller. This creates sharper percentage moves in the COT data when sentiment shifts.
Silver is also a partially industrial metal — it has significant use in solar panels and electronics. This can cause Silver positioning to diverge from Gold during periods where industrial demand expectations shift independently of macro conditions.
A useful observation: when Silver positioning reaches a higher percentile than Gold simultaneously, it often reflects stronger momentum in the metals complex.
Copper: The Economic Barometer
Copper has no safe-haven component. Its positioning reflects almost entirely the market's view on global economic activity — primarily driven by Chinese demand, which accounts for roughly half of global copper consumption.
When speculative Copper positioning moves to extreme net long, it typically means macro traders expect strong global growth. When it moves to extreme net short, they expect a slowdown.
Copper positioning is therefore worth comparing against equity index positioning. Aligned signals (both bullish or both bearish) represent a consistent macro picture. Divergences between the two deserve attention.
Platinum: Smaller Market, Different Dynamics
Platinum sits between precious and industrial in its demand profile. It is used in catalytic converters and hydrogen fuel cells, but also held as a store of value in some markets.
Open interest is materially lower than Gold or Silver, which means:
- Positioning extremes can be reached with smaller absolute contract numbers
- The data can be noisier week to week
- Fewer institutional participants means the positioning is less representative of broad macro consensus
We track Platinum because it is a CFTC-reported NYMEX future, but treat its signals with more caution than the other three.
How Metals Positioning Reads Together
The most useful way to read metals COT data is to look at the pattern across all four markets simultaneously.
A scenario worth noting: Gold and Silver both at 90th+ percentile, Copper at 40th percentile. This would suggest a flight-to-safety drive rather than a broad industrial-demand driven rally. The opposite configuration — Gold flat, Copper high — would suggest growth optimism without safe-haven demand.
These cross-market patterns are covered in weekly blog posts alongside percentile rankings.
Limitations Specific to Metals
Leverage and ETF flows are separate. Large Gold ETF inflows (e.g., GLD) represent physical demand, not futures speculation. COT data does not capture ETF positioning. It is possible for ETF holdings to rise while futures speculation falls, or vice versa.
Seasonality is weak. Unlike agricultural markets, metals do not follow strong seasonal planting or harvest cycles. Some mild seasonal patterns exist (e.g., jewellery demand ahead of certain holidays), but they are not reliable enough to use as a standalone indicator.
Contract sizes make notional comparison difficult. A 10,000-contract net long in Gold (100 oz each = 1,000,000 oz) is a much larger notional position than 10,000 contracts in Platinum (50 oz each = 500,000 oz). Always consider contract size when comparing across markets.
Related Pages
- What Is the COT Report? — foundation reading
- What Are Percentile Rankings? — how we rank positions vs history
- Understanding COT Data for Energy Markets — another commodity category
- COT Glossary — key terms defined
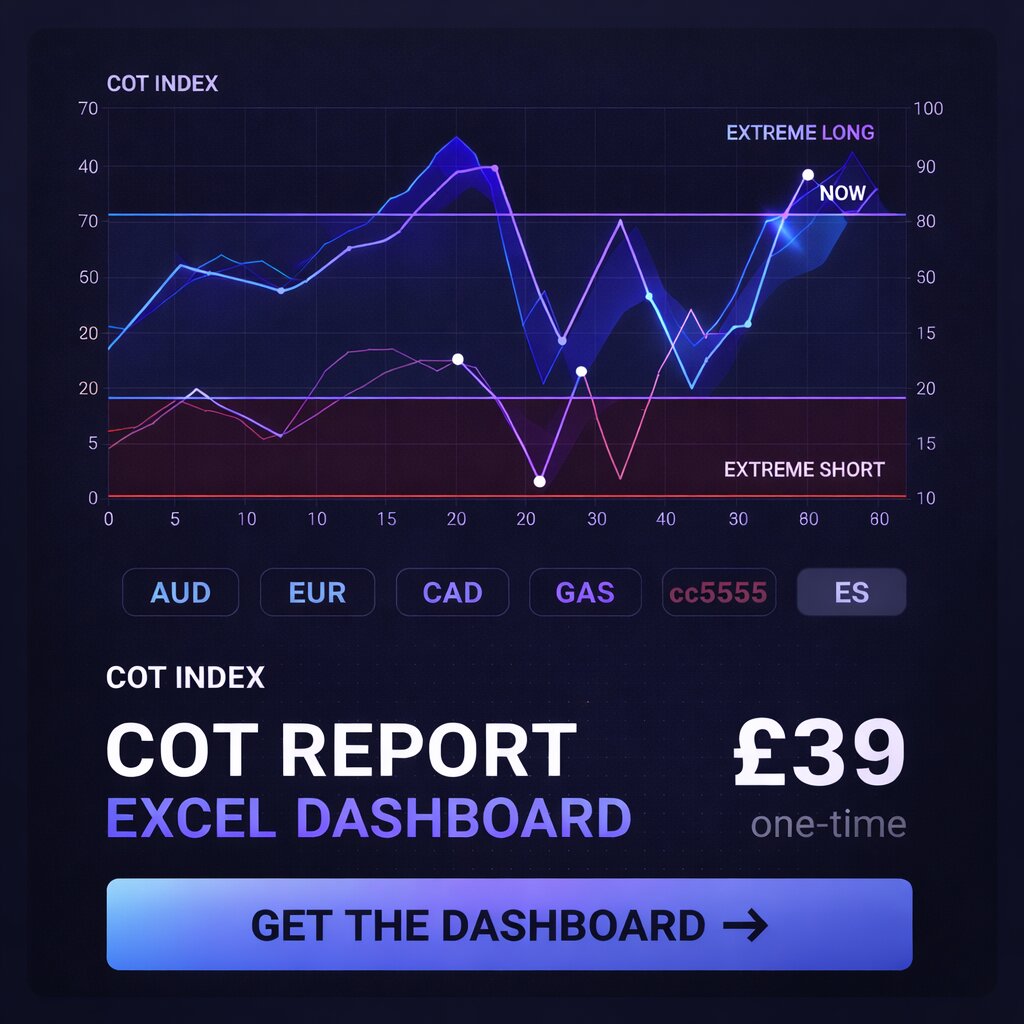
- Interactive Dashboard — current metals positioning data