COT Data Limitations: What It Can't Tell You
Feb 17, 2026
The COT report is a legitimate and widely used tool for understanding futures market positioning. It is also frequently misused — applied to questions it was never designed to answer.
Before relying on COT data in any analysis, it helps to be clear about what the report does not contain.
What the COT Report Is
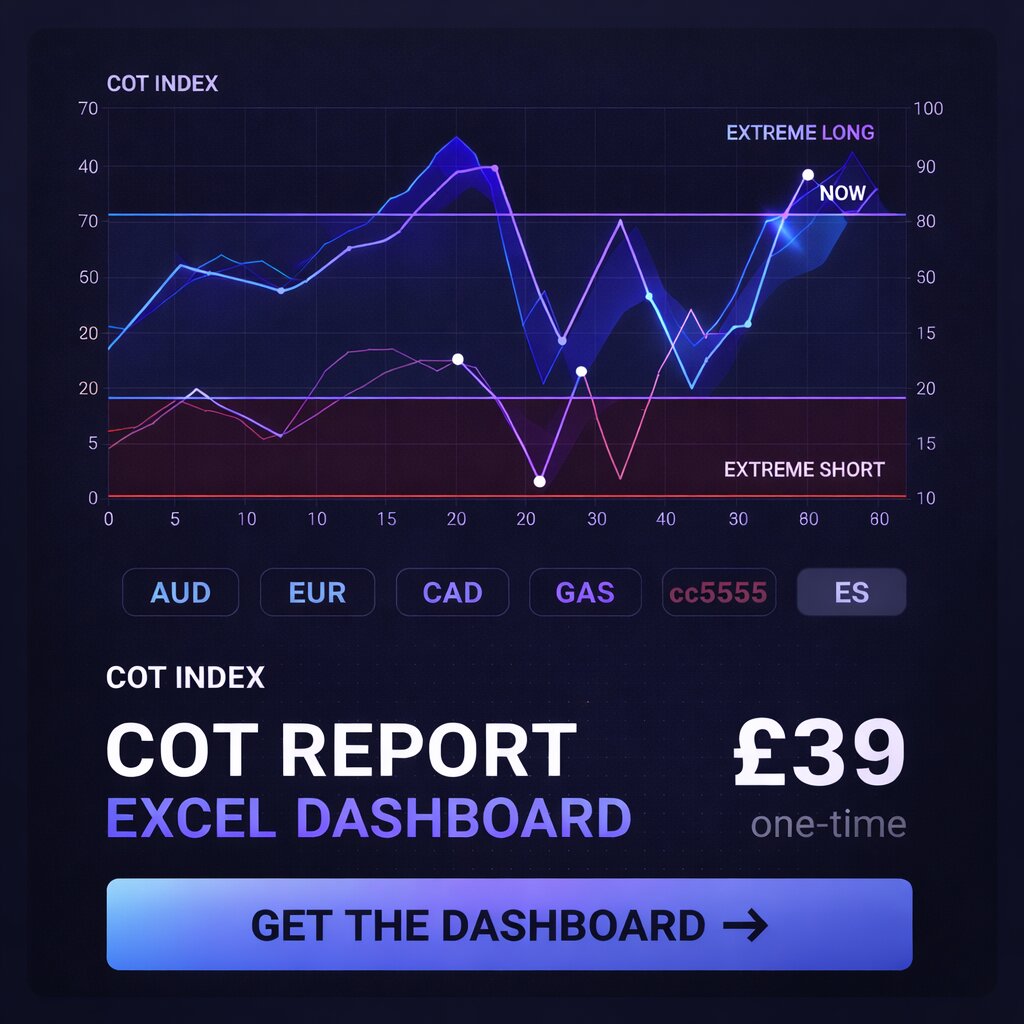
As a baseline: the COT report tells you how large futures market participants are positioned, relative to history.
That is a specific and useful piece of information. It does not extend much beyond that without additional analysis and context.
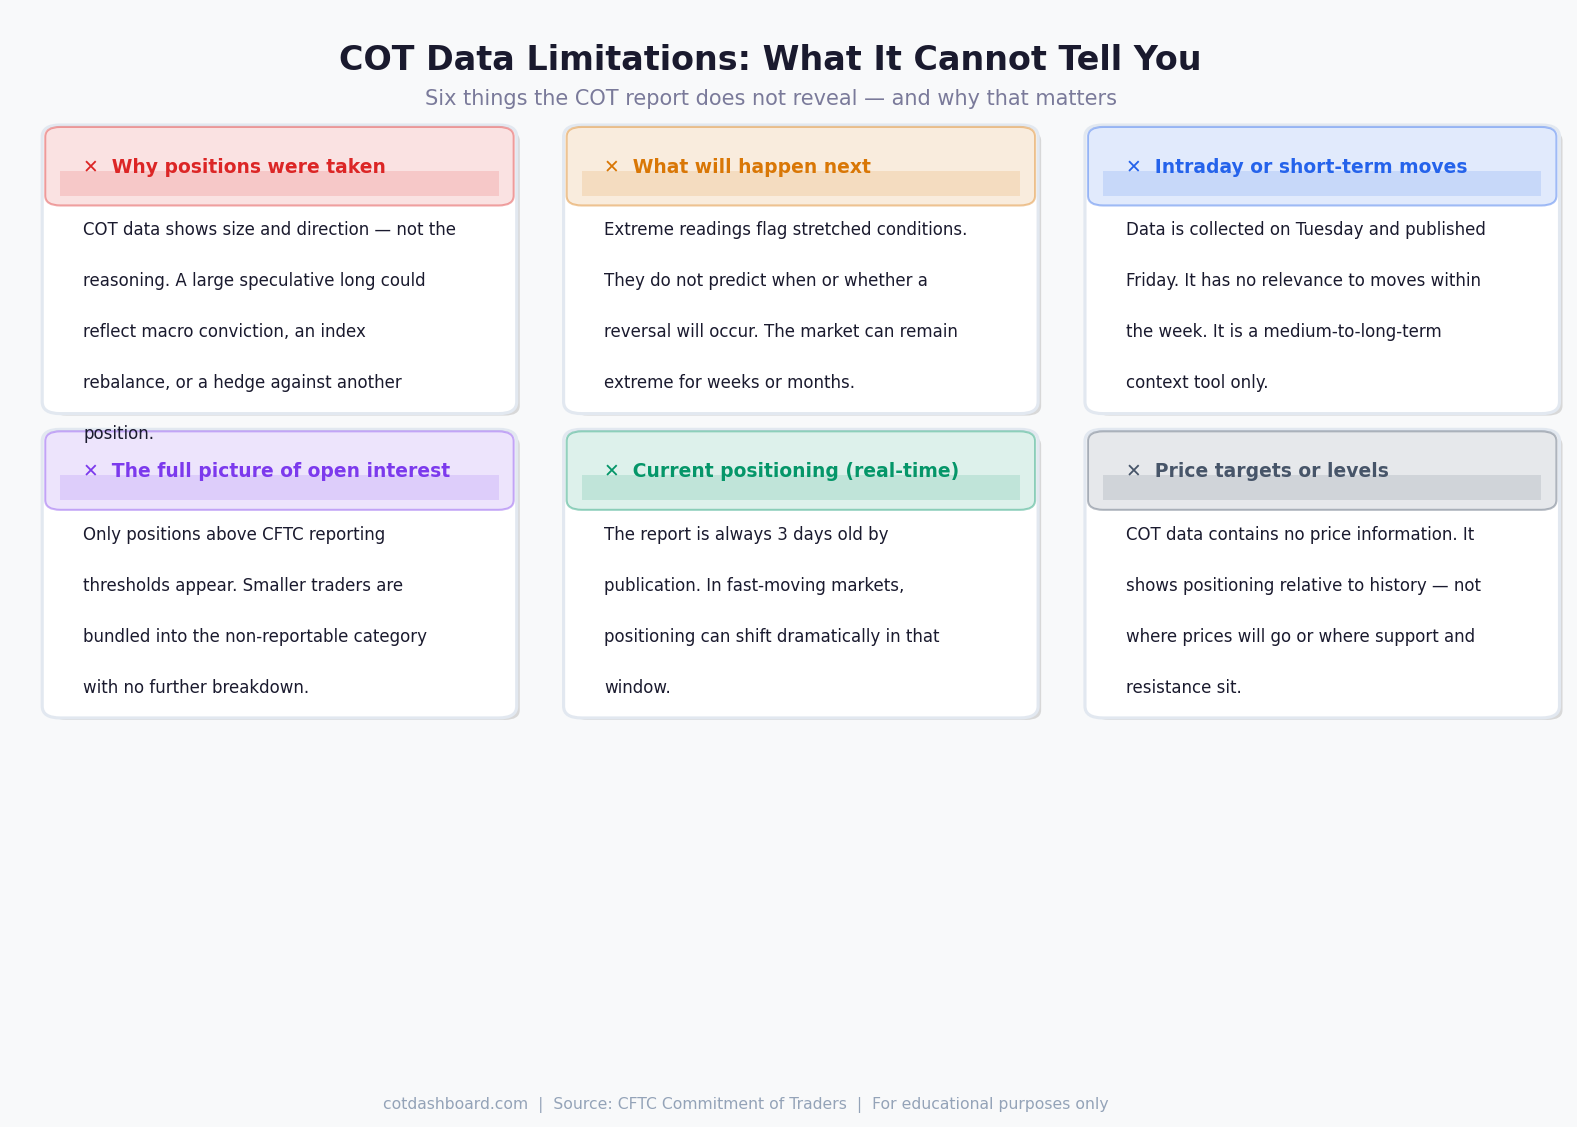
Limitation 1: It Does Not Tell You Why
The COT report records position size and direction. It does not explain the reason behind any position.
A large speculative long in crude oil could mean:
- A macro fund is betting on supply tightening
- An ETF rebalance is mechanically adding exposure
- A hedge fund is offsetting a short position elsewhere
- A passive commodity index is rolling its standard allocation
All of these would appear identically in the legacy report. The disaggregated format improves this slightly by separating managed money from swap dealers, but even then, the reasoning behind positions is unknown.
This matters because the signal value of a position depends on motivation. An index fund mechanically buying has no directional view. Treating its position as a sentiment signal is a mistake.
Limitation 2: It Does Not Time Reversals
Extreme COT readings flag when positioning is historically stretched. They do not indicate when — or whether — a reversal will happen.
A market at the 97th percentile can reach the 99th. It can stay above the 95th percentile for 20 consecutive weeks before unwinding. The extreme reading tells you the trade is crowded; it tells you nothing about the catalyst or timing of an exit.
Analysts who use COT data as a standalone short signal at extreme readings will find that the timing variance is large enough to make the approach inconsistent. The data is more useful as a filter than a trigger.
Limitation 3: It Has No Short-Term Relevance
COT data is collected on Tuesday and published the following Friday. By the time it is public, it is already 3 days old.
For any analysis involving moves within the week, the data is simply irrelevant. A significant news event on Wednesday can shift positioning dramatically before the next report captures it.
Even at a weekly cadence, the data is better suited to identifying multi-week or multi-month positioning trends rather than near-term price moves.
Limitation 4: It Does Not Capture All Participants
The non-reportable category is a residual. It contains every trader whose position is below the CFTC's reporting threshold — which includes retail traders, small funds, and others.
These participants are invisible in the data except as an aggregate. Their individual strategies, sizes, and motivations are unknown.
More importantly, the reporting thresholds vary by market and are not always publicly specified. The boundary between what is and is not visible changes over time as the CFTC adjusts thresholds.
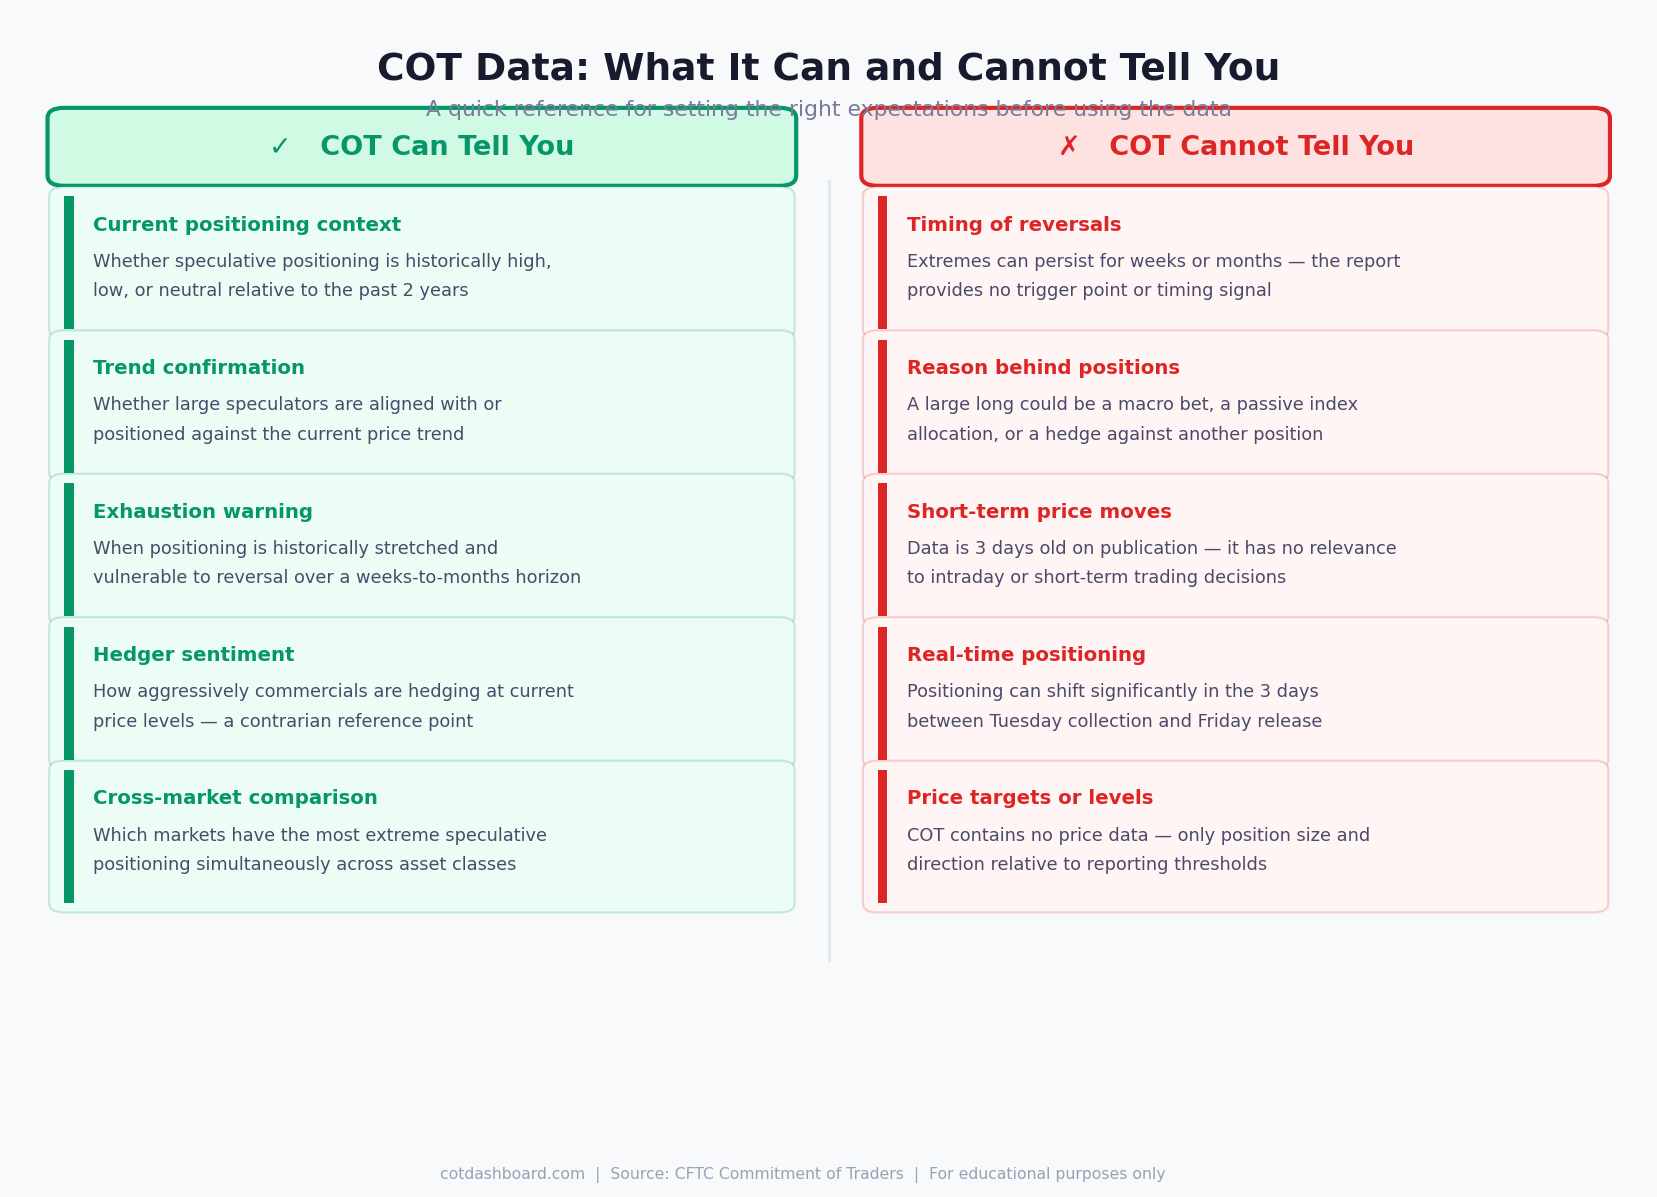
Limitation 5: Real-Time Positioning Is Unknown
The published report is a snapshot from Tuesday. Between Tuesday and the following Friday publication, three full trading days pass.
In volatile markets, positions can shift significantly in that window. A hedge fund that was heavily long on Tuesday may have reduced its exposure substantially by Thursday. The report would still show the Tuesday position.
This lag is not unique to COT data — most public reporting has a lag. But it is worth remembering when the data is discussed as if it reflects current market conditions.
Limitation 6: It Contains No Price Information
The COT report records contracts, not prices. It tells you how many net long or short contracts are held — not where traders entered, what their stop levels are, or where they expect the market to go.
Statements like "speculators are long from these levels" or "commercials expect prices to fall to X" cannot be derived from COT data. The report does not contain any of that information.
This is a common source of overreach in COT commentary. The data supports statements about positioning magnitude and direction relative to history. Price targets or entry levels require separate analysis.
What COT Data Is Actually Good For
With those limitations clear, the data remains genuinely useful for:
- Identifying historically stretched positioning — the core use case
- Confirming or contradicting price trends — are speculators aligned with the move, or fighting it?
- Comparing markets — which markets have the most extreme positioning simultaneously?
- Monitoring unwinding — is a crowded position starting to reduce?
- Risk management context — should you size down because you're trading with an already-crowded consensus?
These are medium-to-long-term applications. They work best alongside other analysis, not as the sole basis for a decision.
How the Dashboard Addresses Some Limitations
The percentile ranking approach at cotdashboard.com mitigates some (not all) of these constraints.
Using a 104-week rolling window normalises positioning across markets with very different absolute contract sizes. A raw contract number for gold is meaningless without context — the percentile rank provides that context automatically.
The weekly update cadence means the lag is always visible — every reading is explicitly dated, so there is no ambiguity about when the data was collected.
What percentile ranks cannot fix: the why, the timing, the real-time gap, and the absence of price information. Those limitations are structural to the report itself.
For related reading, see Do Extreme COT Positions Predict Reversals? and What Are Percentile Rankings in COT Data?