Do Extreme COT Positions Predict Reversals?
Feb 17, 2026
The short answer: sometimes, and not reliably on their own.
Extreme COT positioning is a useful context indicator — it tells you when a market is stretched. It does not tell you when a reversal will happen, or whether it will happen at all before the position unwinds gradually.
Here is what the data shows and where the logic breaks down.
What "Extreme" Means in COT Terms
A position becomes extreme when speculative net longs (or shorts) reach an unusually high percentile rank relative to historical readings.
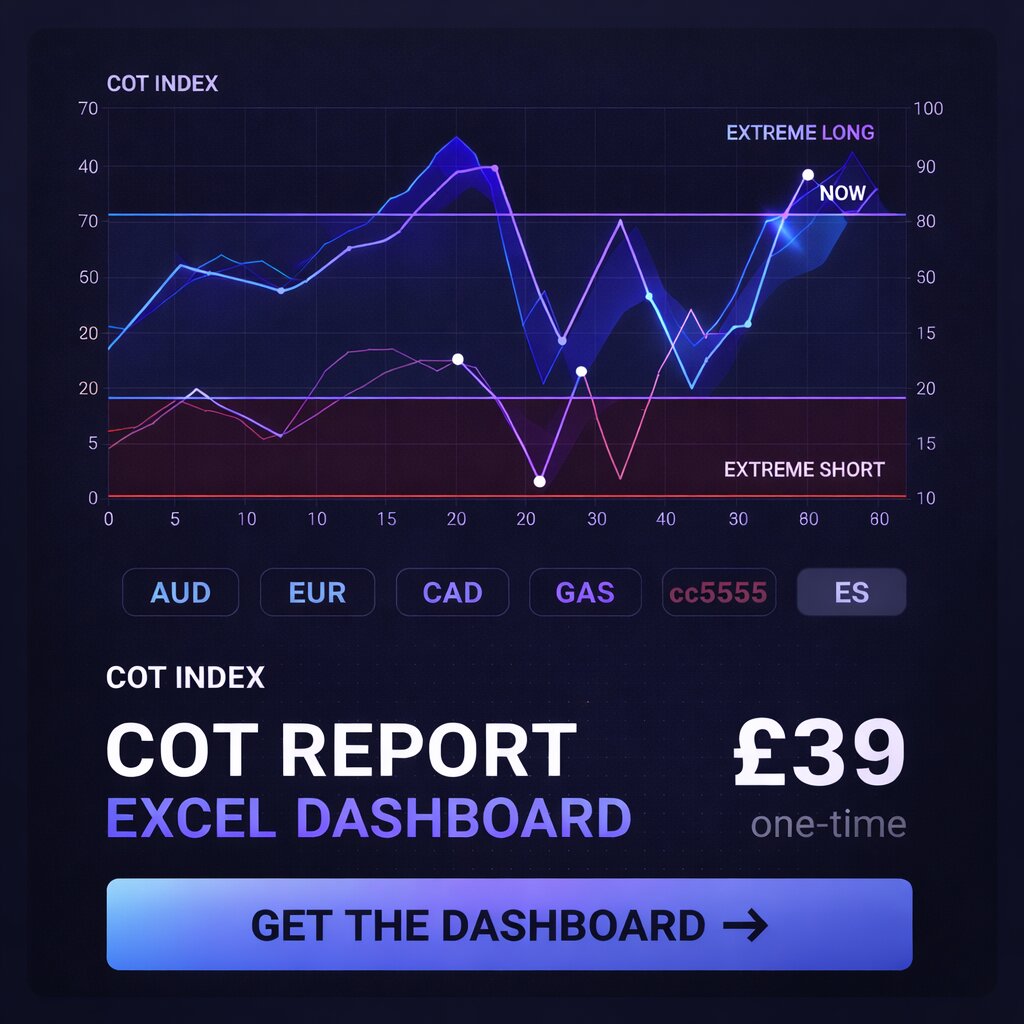
On the cotdashboard.com platform, extremes are defined as:
- 95th–100th percentile — historically extreme net long positioning
- 0th–5th percentile — historically extreme net short positioning
These thresholds are calculated using a 104-week (two-year) rolling window. A market at the 97th percentile means speculative positioning is more net long than in 97% of the weeks over the past two years.
The intuition behind using extremes as a reversal signal is straightforward: if nearly everyone who wants to be long already is, the pool of new buyers shrinks. Without fresh buyers, prices struggle to move higher.
The Hit Rate Question
The honest answer to "do extremes predict reversals?" depends heavily on:
- How you define reversal — a 3% move, a 10% move, a full trend change?
- Over what timeframe — 4 weeks, 13 weeks, 6 months?
- How extreme is extreme — top 10%, top 5%, top 2%?
The general pattern from historical analysis:
- At shorter timeframes (4 weeks), extreme readings perform barely better than chance
- At medium timeframes (13 weeks), there is a modest edge at the most extreme thresholds
- The 26-week window shows the strongest results, but with significant variance across markets
This means COT extremes are better thought of as a medium-term context signal rather than a timing tool.
Why the Logic Holds — And Where It Breaks Down
Why it holds:
Futures positioning is a finite resource. Positioning cannot grow indefinitely. A market where 97% of historical weeks showed fewer speculative longs is, by definition, near a ceiling of speculative demand.
When sentiment reverses — due to macro data, a price shock, or simply time — the unwind of crowded positions amplifies the move. Funds that are long all exit at once, creating acceleration on the downside.
Where it breaks down:
Crowded trades can stay crowded for a long time. A market at the 95th percentile can reach the 99th percentile. It can stay above the 90th percentile for 20 weeks before unwinding.
COT data also has a structural lag: the data reflects positions as of Tuesday, published Friday. By the time the report is public, the market has already moved three days. In fast-moving markets, this lag reduces the signal's practical value.
Additionally, the signal completely ignores why positions are extreme. A speculative net long at the 97th percentile in crude oil during a geopolitical supply shock is a very different situation from the same reading in a calm trending market. COT data gives you no information about the fundamental driver.
What Happens After an Extreme Reading
In markets where the signal has historically worked, the typical sequence looks like this:
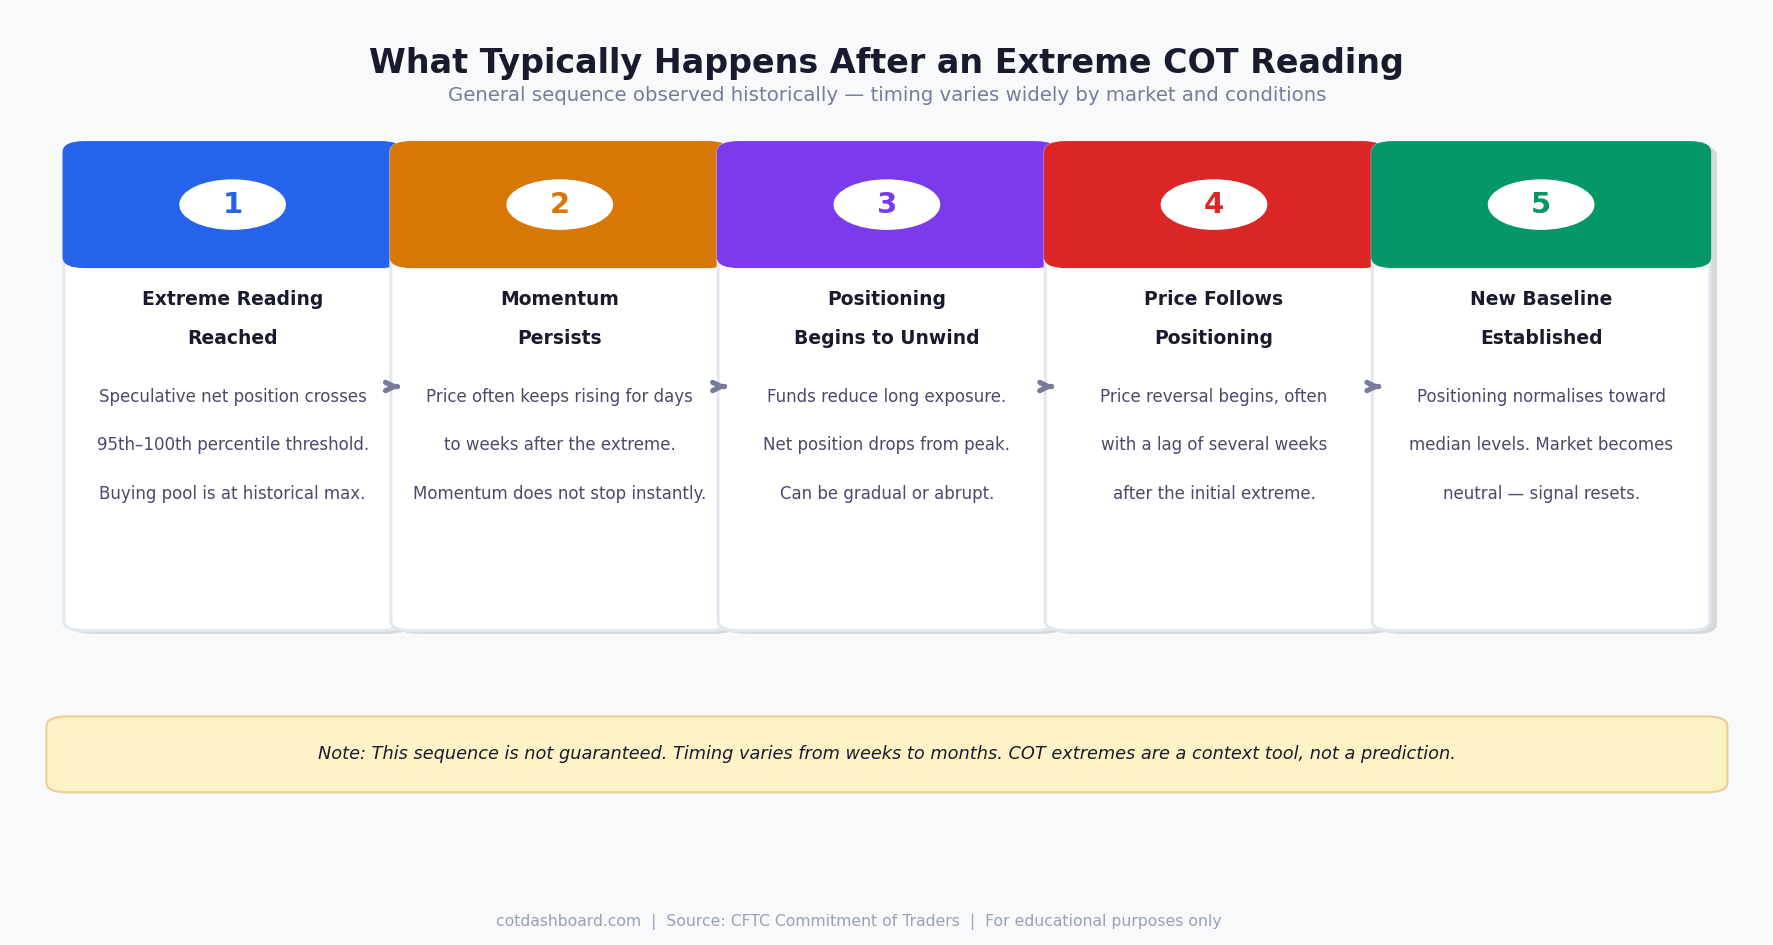
- Speculative positioning reaches extreme (95th+ percentile)
- Price continues rising for a period — sometimes weeks — as momentum holds
- Positioning begins to unwind gradually or abruptly
- Price reversal follows, often with a lag of several weeks
The key observation: the signal tends to precede the price peak, not coincide with it. Calling the exact top is not possible using COT data alone.
What Makes the Signal More Reliable
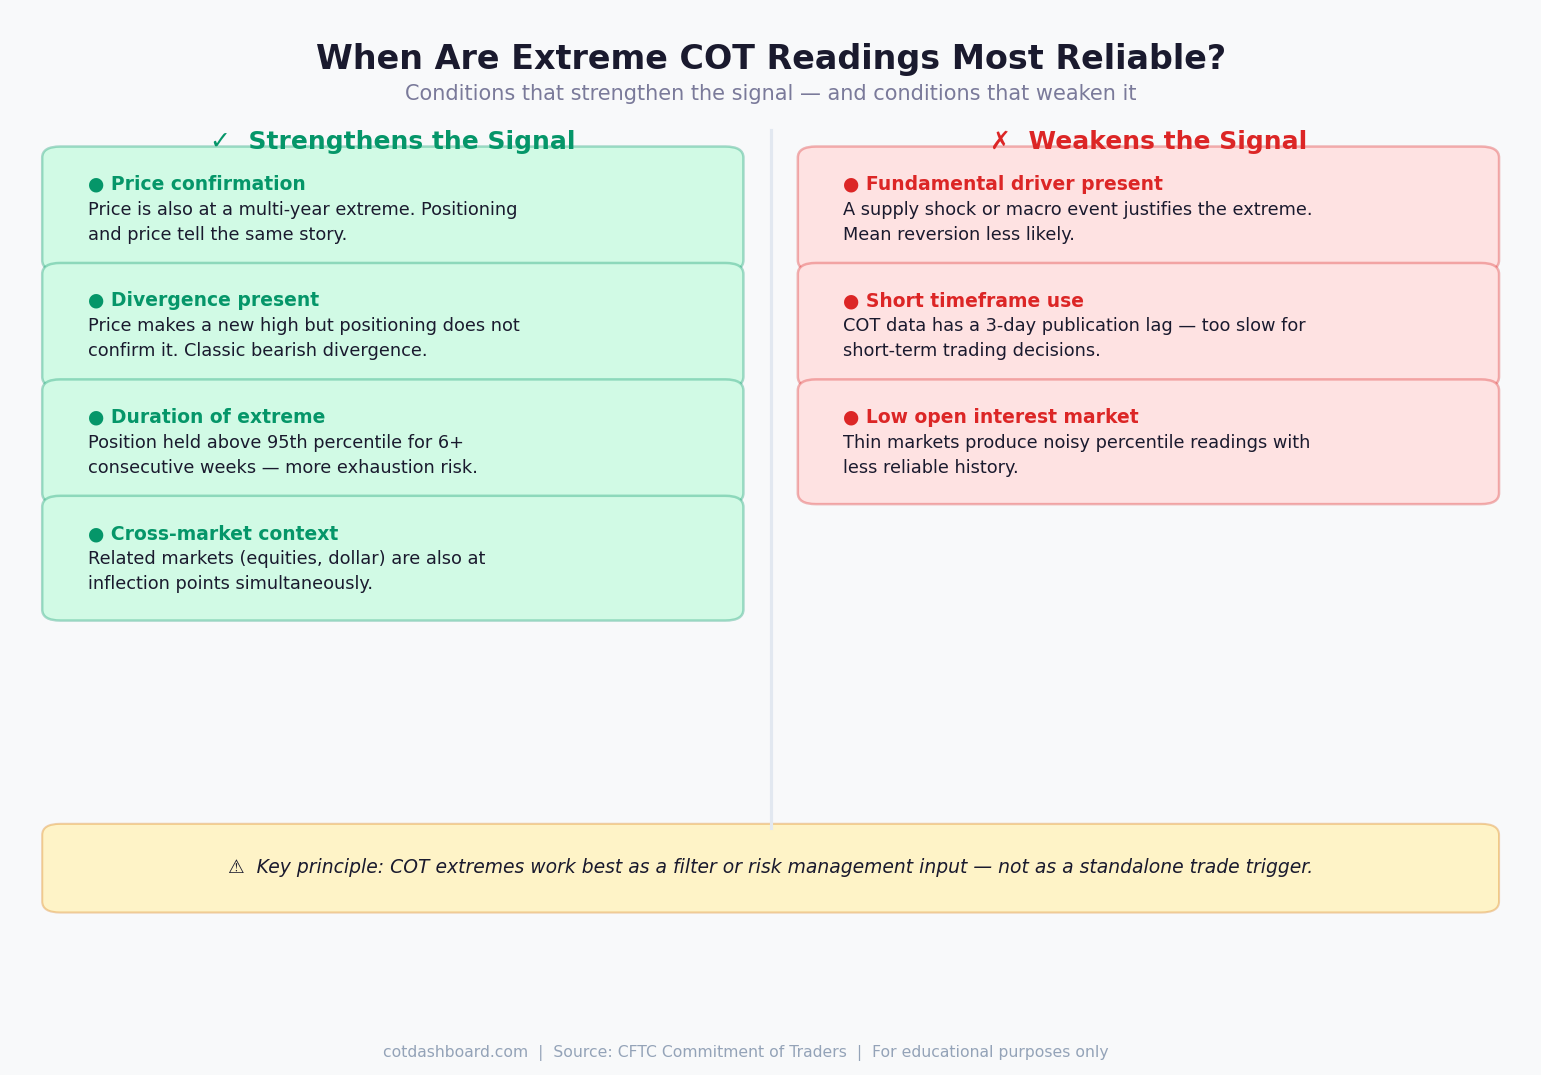
Several conditions improve the usefulness of extreme COT readings:
Confirmation from price action. If positioning is at a 95th percentile extreme but price is also hitting multi-year highs and showing momentum exhaustion signals, the setup is stronger than positioning alone.
Divergence. When price makes a new high but positioning does not confirm (i.e. speculative longs are declining while price rises), that divergence is a more specific warning than extreme positioning alone.
Cross-market context. An extreme in crude oil positioning carries more weight if energy equities, refinery margins, and dollar positioning are also at inflection points.
Duration of the extreme. A position that has been at the 95th+ percentile for 8 consecutive weeks carries more exhaustion risk than one that just crossed the threshold.
What the Signal Should Not Be Used For
Entry timing. "COT is extreme, therefore sell now" is not a valid use of the data. The signal has no short-term precision.
Standalone trade signals. COT data works best as one input among several. Using it alone has poor risk-adjusted results in most systematic backtests.
Low-liquidity or thinly traded markets. In markets with low open interest or irregular reporting, the percentile ranks are less stable and the signal is noisier.
Practical Application
The most common professional use of COT extremes is as a filter, not a trigger.
A fund might decide: "We will only take new long positions in this market if speculative positioning is below the 60th percentile." This does not generate trade signals — it removes trades that would be working against a crowded positioning setup.
Similarly, an extreme reading can be used to tighten risk management on an existing long position. Not as a reason to exit immediately, but as a reason to move stops closer and reduce position size.
Summary
| Question | Answer |
|---|---|
| Do extremes predict reversals? | Sometimes — at medium timeframes and high thresholds |
| Is it a precise timing tool? | No — lag can be weeks to months |
| What improves the signal? | Divergence, price confirmation, duration |
| Can it be used standalone? | Not reliably |
| Where is it most useful? | As a filter or risk management input |
The cotdashboard.com percentile rankings give you a consistent way to identify extreme readings across multiple markets simultaneously. That is the primary value — not generating signals, but flagging which markets are in stretched territory so you can apply additional analysis there.
For related reading, see What Are Percentile Rankings in COT Data? and Commercial vs Non-Commercial Traders: What's the Difference?