Understanding COT Data for Equity Index Markets
Feb 13, 2026
Equity index futures COT data shows how large speculators — primarily hedge funds and commodity trading advisors — are positioned in the major US stock index futures. This category is distinct from others in one key respect: the "commercial" hedgers here are primarily institutional investors using futures to hedge equity portfolio risk, not physical commodity producers.
This guide covers the five index futures we track and explains the dynamics that make this category behave differently from commodity or FX markets.
The Five Index Futures We Track
| Symbol | Market | CFTC Code | Contract Value (approx) | Exchange |
|---|---|---|---|---|
| ES | S&P 500 | 13874+ | CME | |
| NQ | Nasdaq 100 | 20974+ | CME | |
| YM | Dow Jones | 12460+ | CBOT | |
| RTY | Russell 2000 | 239742 | CME | |
| VX | VIX | 1170E1 | $1,000 × index | CBOE |
Contract values fluctuate with index levels, unlike commodity contracts with fixed quantities. At current market levels, a single ES (S&P 500) contract represents over $500,000 in notional exposure.
How Index Futures Positioning Works
A net long position in S&P 500 futures means speculators collectively hold more buy contracts than sell contracts — they expect the index to rise. A net short position means the reverse.
One important distinction from commodity markets: the direction of price and the direction of demand are less tightly coupled. A declining stock market can attract both short sellers (profiting from declines) and long buyers (averaging into weakness). COT data shows the net result of all these positions, not the underlying reasons for each.
For equity futures specifically:
- Net long at a high percentile indicates elevated speculative optimism about equity prices
- Net short is rare for the major indices over multi-year periods — sustained net short positioning in S&P 500 futures typically only occurs during severe bear markets
- Rapid moves from long to short represent a meaningful shift in institutional conviction
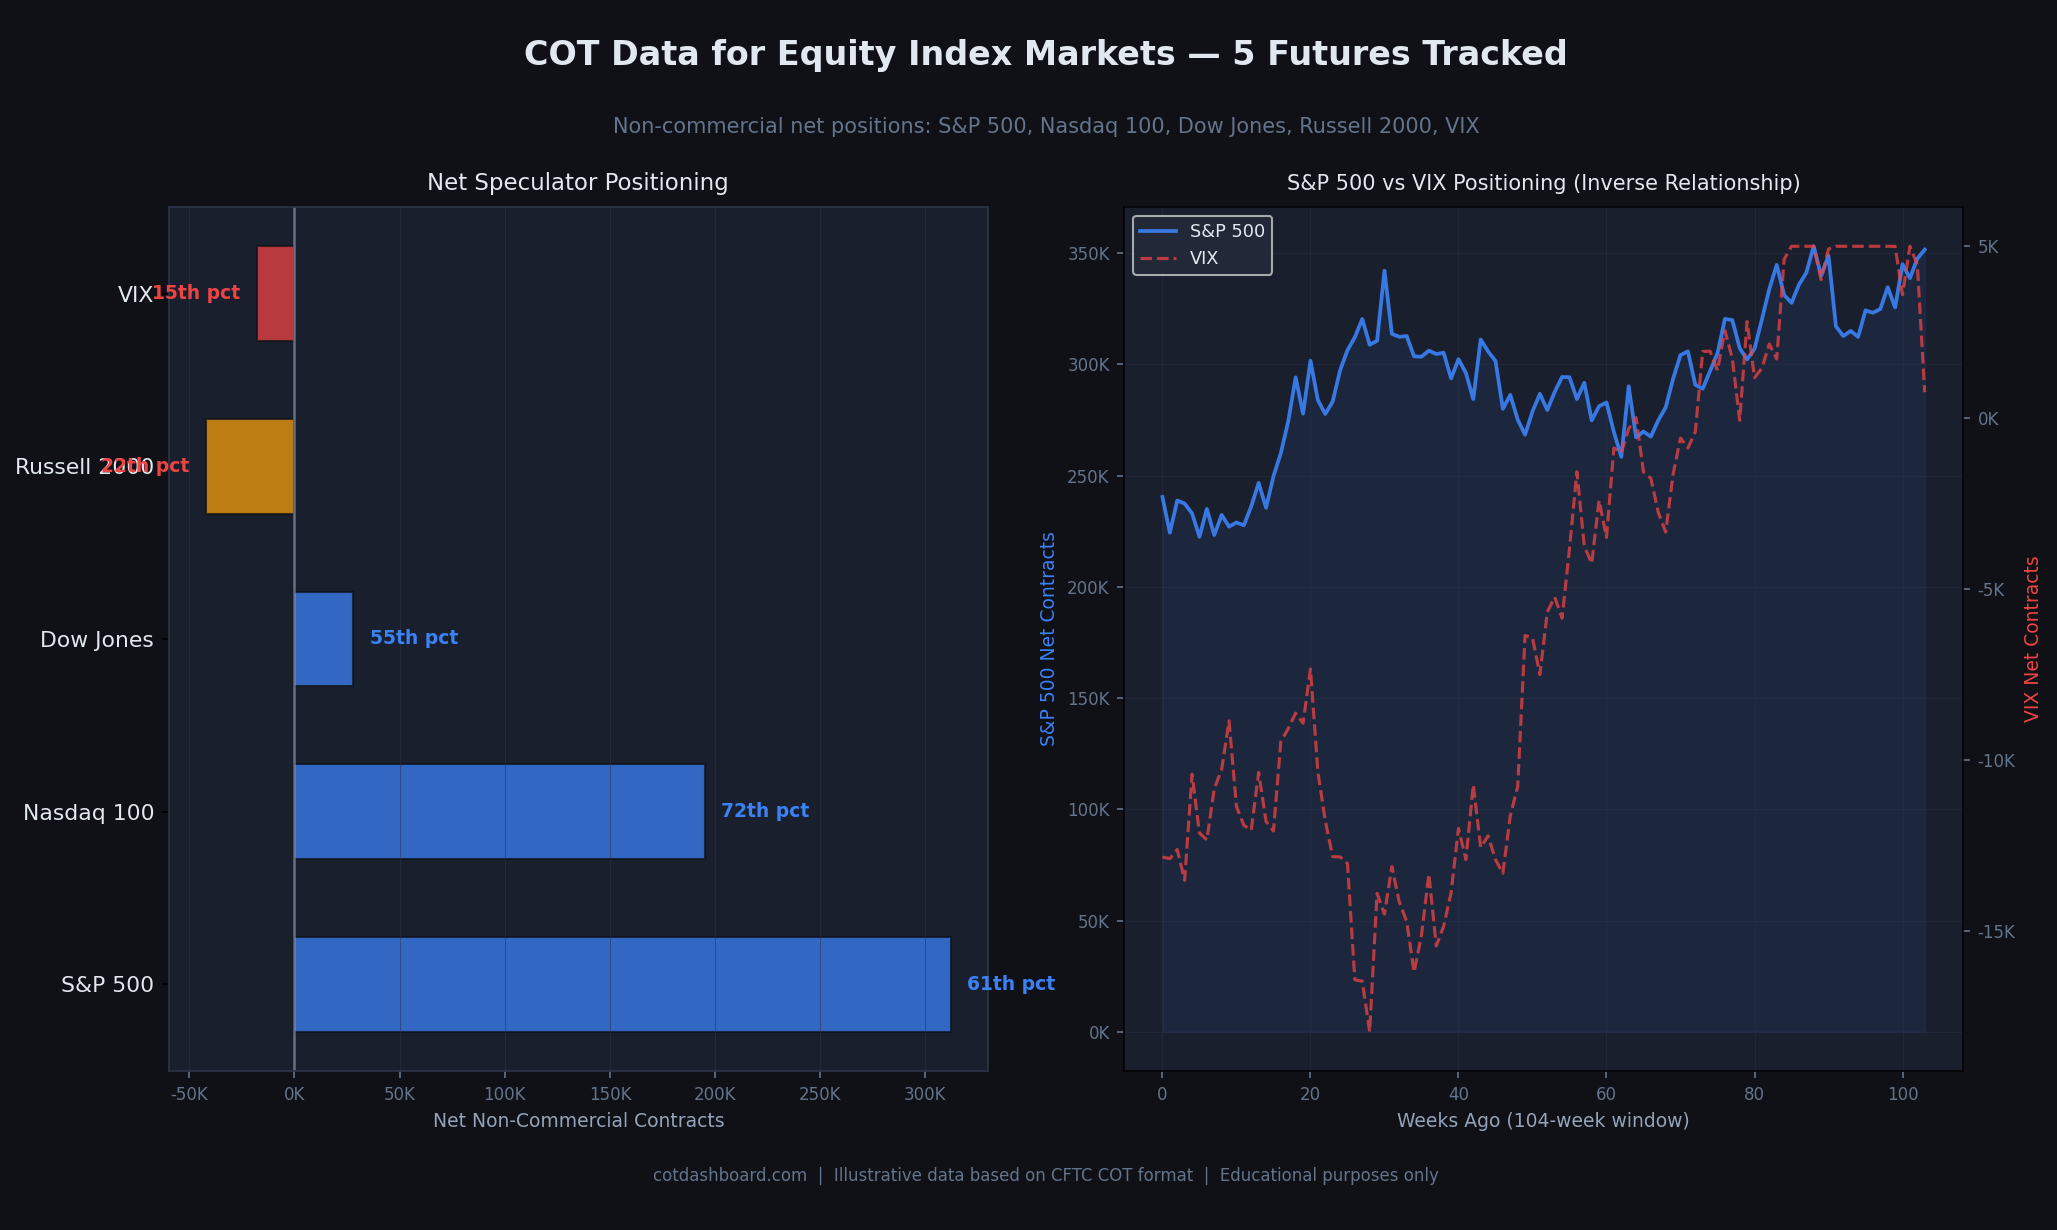
Left: current net positions for all five markets. Right: 104-week history showing the inverse relationship between S&P 500 positioning (blue) and VIX positioning (red dashed). When equity longs build, VIX longs collapse — and vice versa.
The Four Equity Indices: Size and Style Differences
S&P 500 (ES) is the benchmark. It has the highest open interest and represents the broadest measure of large-cap US equity sentiment. Most cross-market analysis references S&P 500 positioning first.
Nasdaq 100 (NQ) has high correlation with the S&P 500 but is more heavily weighted toward technology and growth stocks. When Nasdaq positioning reaches a higher percentile than S&P 500 positioning, it suggests speculative enthusiasm is concentrated in the tech sector. Divergences between ES and NQ positioning are worth noting.
Dow Jones (YM) is the smallest of the three large-cap futures in terms of open interest. Its COT data is less institutionally representative and tends to have noisier week-to-week moves. We track it for completeness but treat it as a secondary signal.
Russell 2000 (RTY) represents small-cap US equities. Positioning here often diverges from the S&P 500 during periods where investors are rotating between large and small caps. Extreme net short positioning in Russell 2000 alongside neutral S&P 500 positioning can indicate selective pessimism about smaller companies rather than broad equity bearishness.
VIX Futures: The Inverse Relationship
VIX futures measure positioning on the CBOE Volatility Index — often called the "fear gauge." Because VIX rises when equity markets fall and falls when markets are calm, VIX positioning behaves inversely to equity positioning.
A net short VIX position means speculators expect volatility to remain low — they are effectively selling insurance against large market moves. This correlates with a bullish equity sentiment backdrop.
A net long VIX position means speculators expect volatility to rise — a bearish or defensive stance.
The visual chart on this page shows the inverse relationship clearly: when S&P 500 net long positioning builds, VIX net positioning tends to fall (or stay short). When equity positioning unwinds, VIX positioning often shifts toward net long as traders buy protection.
Monitoring both together provides a more complete picture of institutional risk appetite than looking at either in isolation.
Interpreting Equity Index Extremes
Because US equities have experienced a multi-decade uptrend, the distribution of speculative positioning is skewed positive. Long-term net long readings are the norm rather than the exception for the S&P 500. This means:
- A 90th percentile net long in S&P 500 is notable but not shocking in the context of a bull market
- A net short reading at any percentile is structurally unusual and worth examining
- The most informative readings are rapid direction changes — large-week shifts from high long percentile to lower percentile, or vice versa
For the Russell 2000 and VIX, the distribution is less skewed. Extreme readings in these markets can be more informative because both markets regularly show net positions on either side of zero.
Cross-Index Patterns Worth Watching
S&P 500 and Nasdaq diverging: If Nasdaq positioning is at 90th percentile while S&P 500 is at 55th, it suggests concentrated tech-specific optimism. If the situation reverses (S&P long, Nasdaq neutral or short), it suggests defensive rotation — large caps favoured over tech.
Russell 2000 versus large caps: When Russell 2000 positioning is significantly more bearish (lower percentile) than S&P 500 positioning, it can indicate macro caution — small caps are more sensitive to domestic credit conditions and economic slowdowns than the multi-national companies dominating the S&P 500.
VIX net long alongside net long equities: This is a unusual configuration. It suggests speculators are simultaneously bullish on equities but buying volatility protection — a hedged risk-on stance rather than pure conviction long.
What Equity Index COT Data Cannot Tell You
It does not capture actual equity ownership. COT futures positioning reflects derivatives, not physical stock holdings. Mutual funds, pension funds, and insurance companies holding trillions in equities do not appear in this data unless they use CME futures specifically.
It reflects Tuesday closing positions. The report is released on Friday but reflects positions as of the prior Tuesday. For equity markets, which can move significantly on major earnings, Fed decisions, or economic data between Tuesday and Friday, the data may already be stale when published.
Passive and systematic flows dominate. A large portion of equity futures positioning reflects trend-following CTAs and quantitative strategies rather than fundamental views. These strategies build long positions when prices are rising and exit when prices fall — which can make extreme long positions coincide with high prices (late-cycle) rather than cheap prices.
Related Pages
- What Is the COT Report? — foundation reading
- How to Read COT Data — column-by-column walkthrough
- What Are Percentile Rankings? — how positions are ranked vs history
- Commercial vs Non-Commercial Traders — who the institutional hedgers and speculators are in equity futures
- How Hedge Funds Use COT Data — practical applications, especially relevant for equity index positioning
- COT Report vs Other Sentiment Indicators — how COT compares to VIX, put/call ratio, and AAII survey
- COT Data Limitations — what the weekly data cannot tell you
- Understanding COT Data for Bond Markets — equities and bonds are closely linked through risk appetite
- Understanding COT Data for Crypto Markets — another risk-asset category with similar sentiment drivers
- COT Glossary — key terms defined
- Interactive Dashboard — current equity index positioning data