COT Report vs Other Sentiment Indicators
Feb 17, 2026
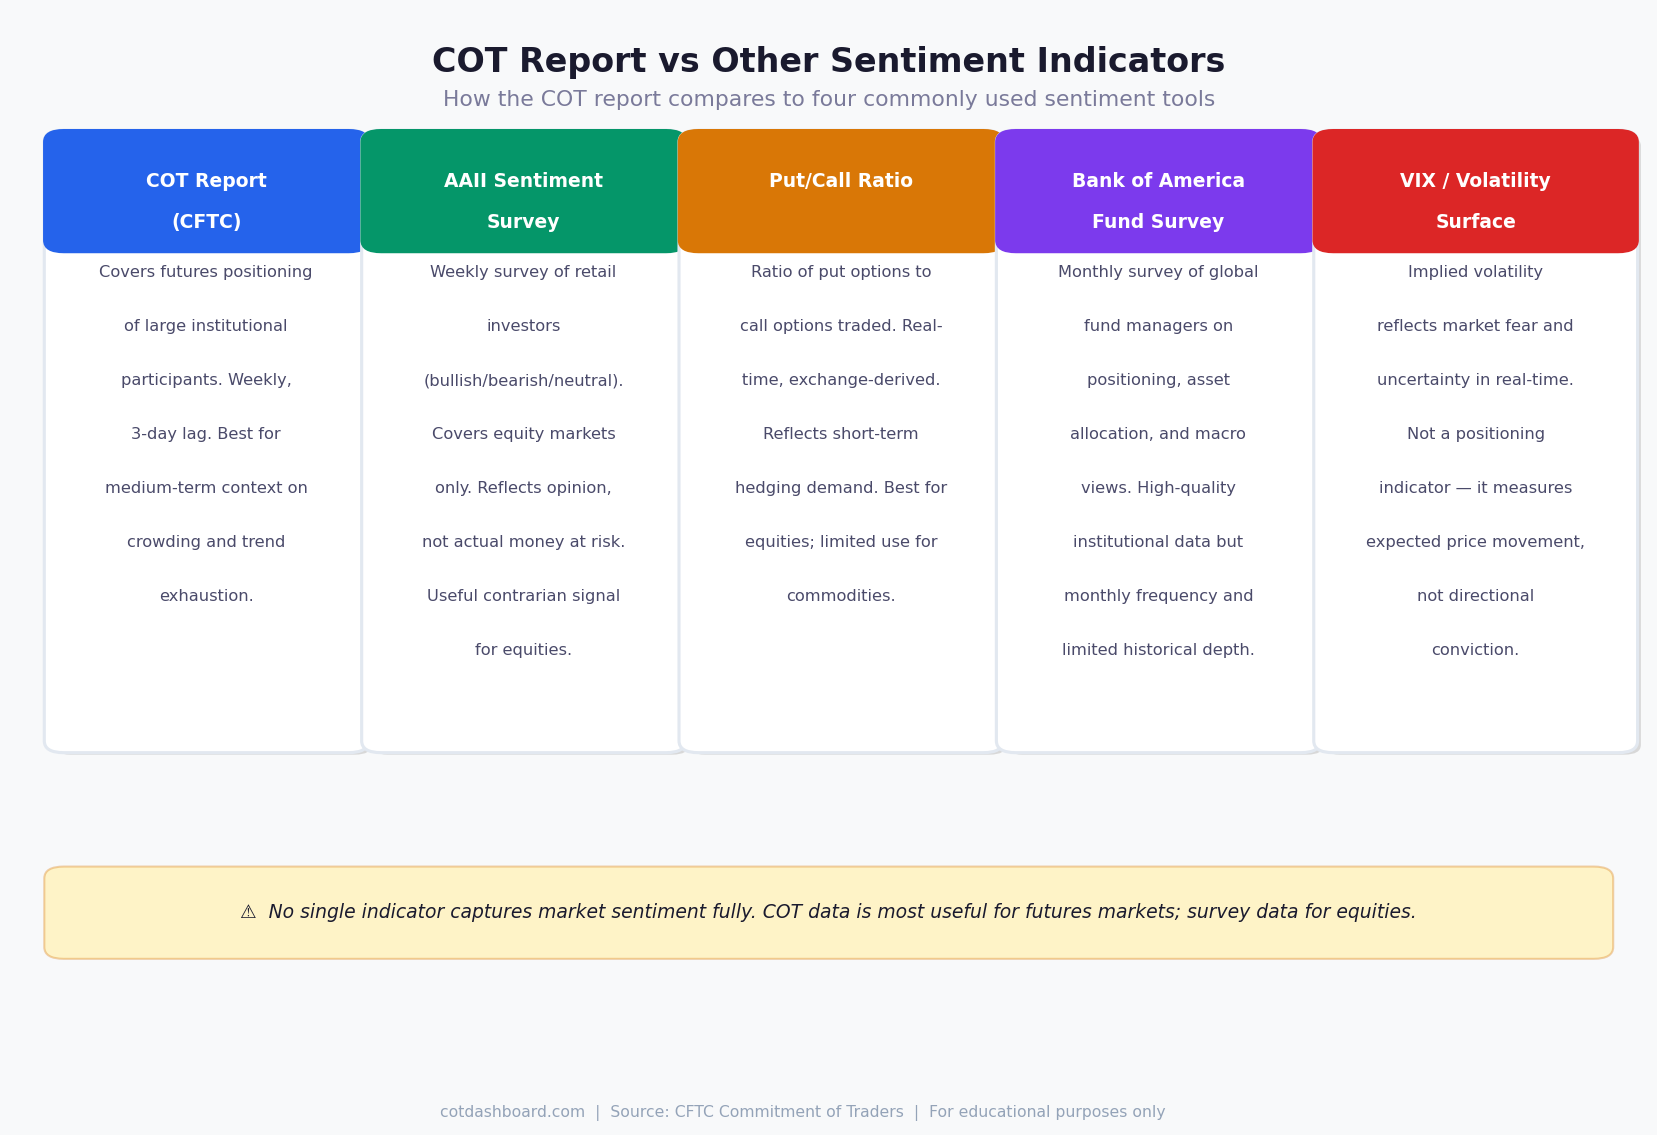
The COT report is a positioning indicator — it measures what large futures market participants are actually doing with their money. Other sentiment tools measure different things: stated opinions, options hedging behaviour, or survey responses.
Understanding the difference matters. Each tool has a specific strength and a specific blind spot.
The Four Main Sentiment Tools
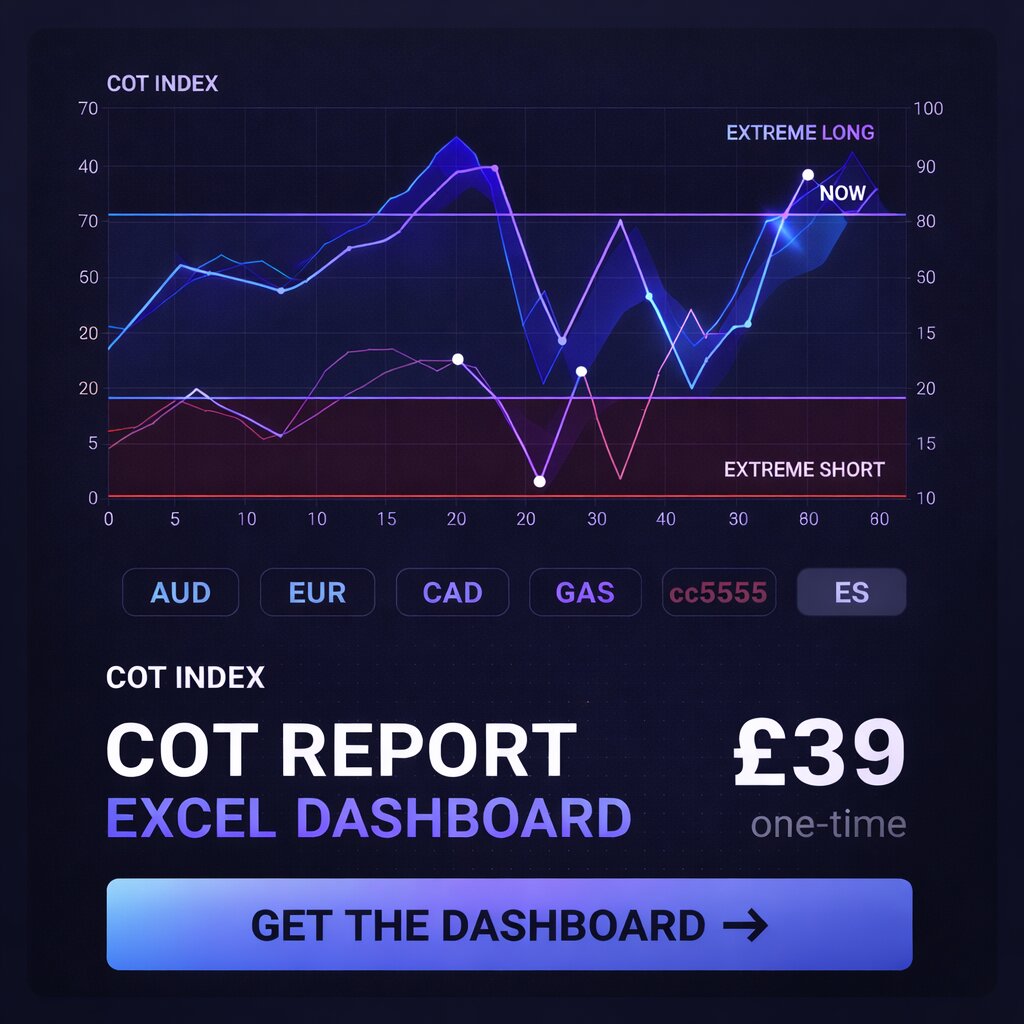
COT Report
What it measures: Actual futures positions held by large institutional participants, sorted by trader type (commercial, non-commercial).
Strengths:
- Reflects real money, not stated opinions
- Covers a broad range of futures markets (FX, commodities, equity indices, bonds)
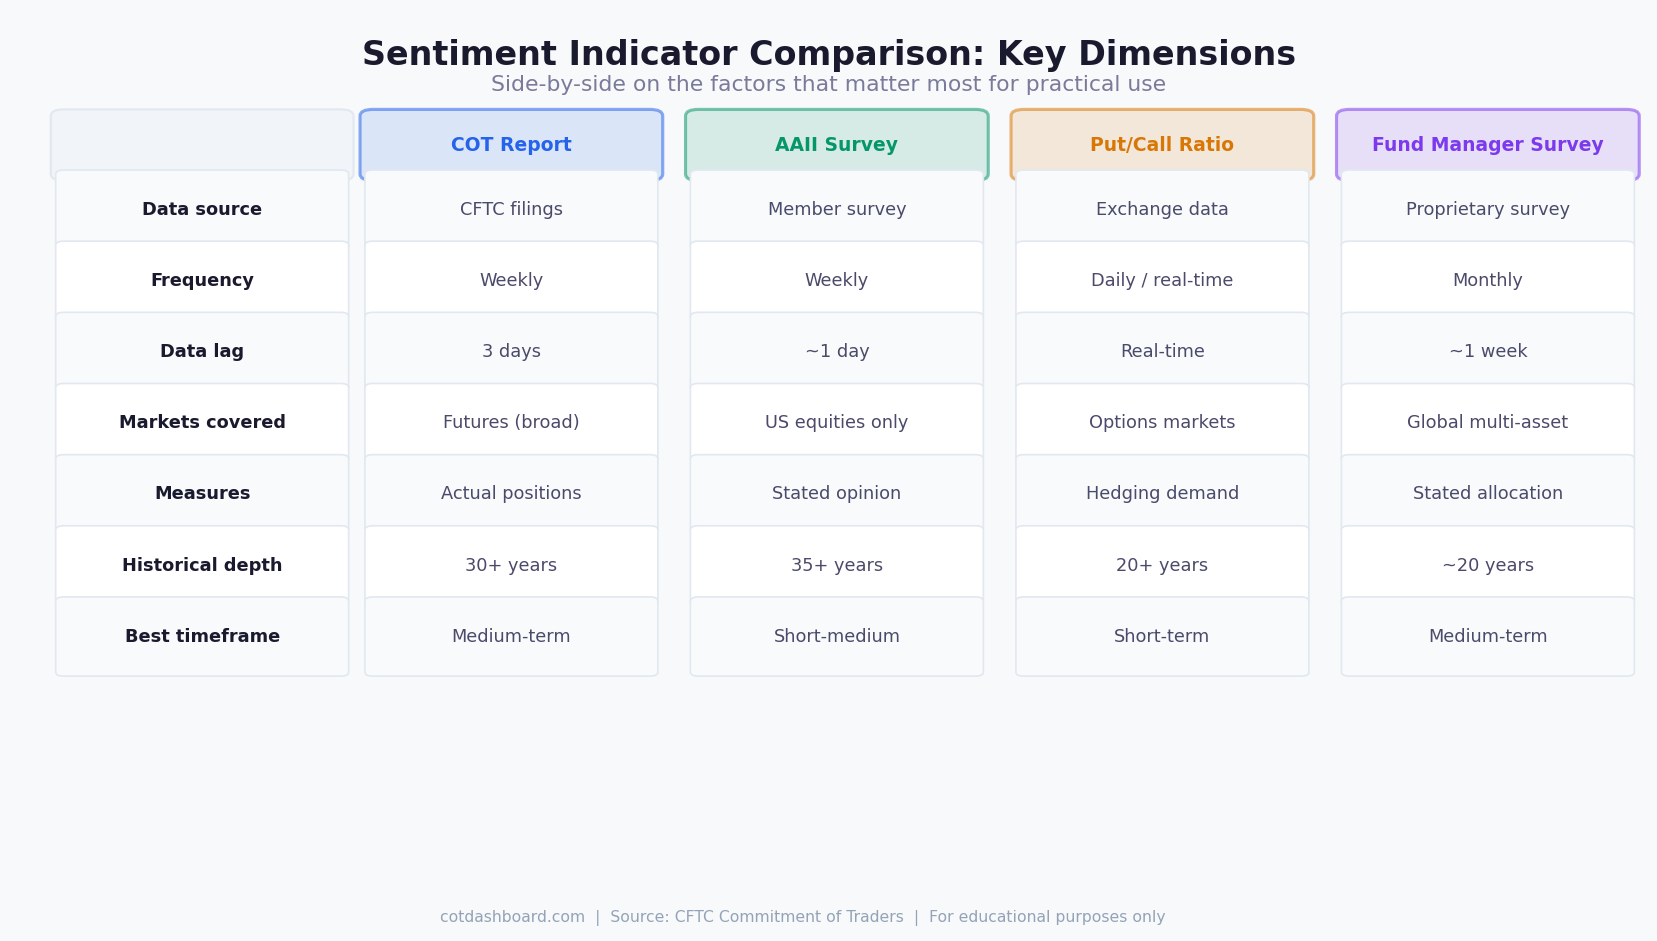
- Long historical record — usable data going back 30+ years for major markets
- Consistent methodology across markets
Weaknesses:
- 3-day publication lag — not useful for short-term decisions
- Legacy format lumps different speculator types together
- No information on why positions were taken or where entry levels are
Best for: Medium-term context on crowding and potential exhaustion in futures markets.
AAII Investor Sentiment Survey
The American Association of Individual Investors publishes a weekly survey asking members whether they are bullish, bearish, or neutral on equities over the next 6 months.
What it measures: Stated opinion of retail investors — not actual positions.
Strengths:
- 35+ years of history
- Widely used as a contrarian indicator for US equities
- Simple and transparent methodology
Weaknesses:
- Covers US equities only — no commodity, FX, or bond coverage
- Measures intention, not execution. Respondents may say "bearish" while remaining fully invested
- Small survey sample size relative to total market participation
Best for: Gauging retail equity sentiment as a contrarian backdrop. Most useful at extreme readings (above 60% bulls or above 50% bears).
Put/Call Ratio
The put/call ratio measures the volume of put options traded relative to call options on a given exchange or index.
What it measures: Hedging and speculative demand in the options market — a real-money indicator.
Strengths:
- Real-time and exchange-derived — no publication lag
- Reflects actual market activity, not surveys
- Useful across equity indices, individual stocks, and some ETFs
Weaknesses:
- Dominated by institutional hedging, which distorts the retail sentiment reading
- Limited relevance outside equity markets — poor coverage of commodities and FX
- Requires normalisation to be useful (a ratio that looks "extreme" today may be normal in a high-volatility regime)
Best for: Short-term equity hedging demand. Works well alongside VIX and price action for near-term timing.
Bank of America Global Fund Manager Survey
Published monthly, this survey polls global institutional fund managers on their asset allocation, risk appetite, and macro views.
What it measures: Stated positioning and views of large institutional asset managers — not retail.
Strengths:
- High-quality institutional respondents managing large pools of capital
- Covers global asset allocation across equities, bonds, commodities, cash, and regions
- Tracks relative overweight/underweight positioning — useful for identifying crowded consensus views
Weaknesses:
- Monthly frequency — significantly lower resolution than weekly COT data
- Shorter history than COT
- Stated allocation may differ from actual portfolio execution
Best for: Identifying consensus macro positioning and potential contrarian opportunities at the multi-asset level.
VIX and Implied Volatility
The VIX measures the market's expectation of 30-day volatility in the S&P 500, derived from options prices.
What it measures: Expected price movement — not directional positioning. A high VIX means the market expects large moves in either direction, not necessarily a decline.
VIX is often misused as a sentiment indicator. It measures uncertainty and fear, but a low VIX does not mean the market is positioned bullishly — it means it expects calm conditions.
Best for: Volatility regime context. Useful alongside positioning data, not as a substitute for it.
How to Use These Together
No single indicator captures the full picture. A practical approach for equity markets:
- COT data for equity index futures positioning context
- AAII survey for retail sentiment backdrop
- Put/call ratio for near-term hedging demand
- Fund manager survey for institutional consensus
When multiple indicators point in the same direction simultaneously, the signal is more meaningful. Divergence between indicators often signals a transition period.
For commodity and FX markets, the COT report is typically the most useful single tool available — survey data has poor coverage, and options markets are less liquid.
For related reading, see COT Data Limitations: What It Can't Tell You and Do Extreme COT Positions Predict Reversals?