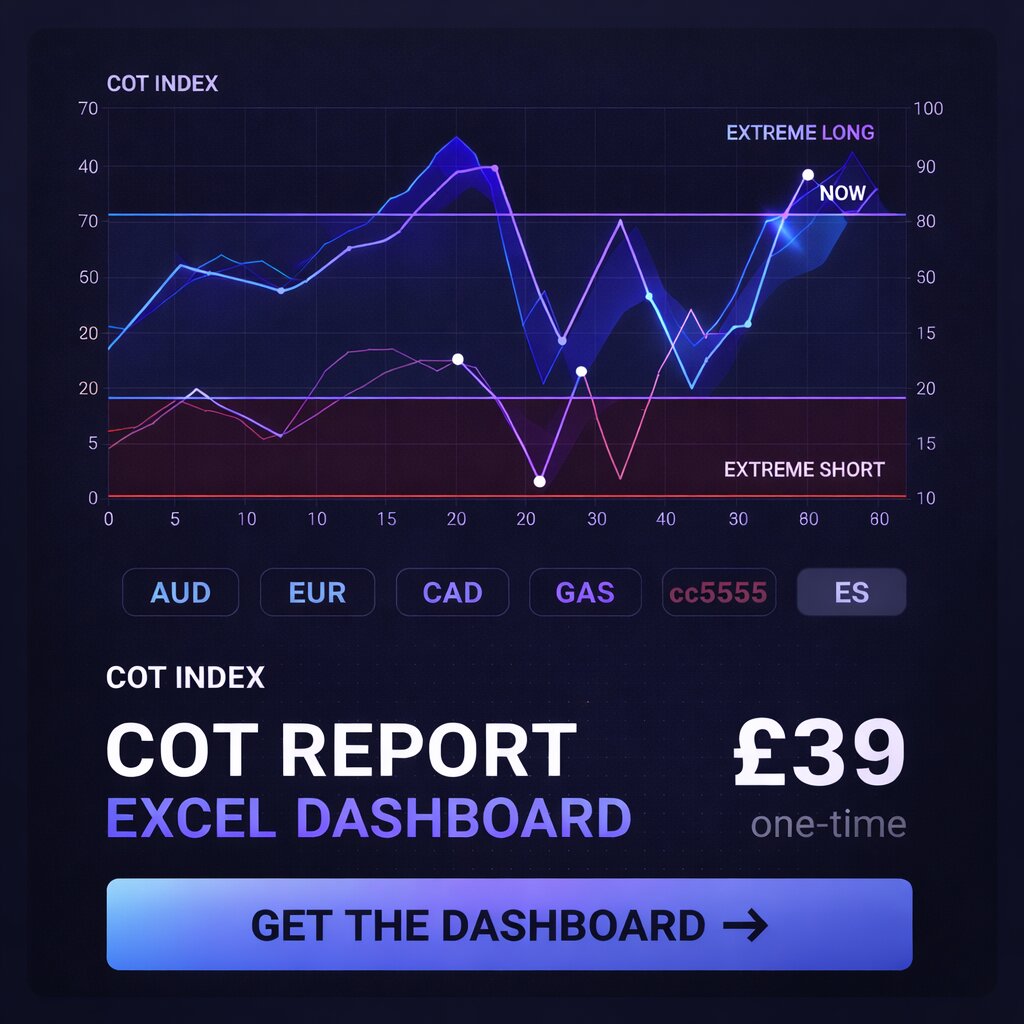
How Hedge Funds Use COT Data
Feb 17, 2026
Hedge funds and professional traders do not use COT data the way it is often described in retail trading circles — as a signal to fade whenever positioning reaches an extreme.
The actual applications are more nuanced and, critically, more conservative in what they claim the data can do.
What Hedge Funds Are Actually Looking At
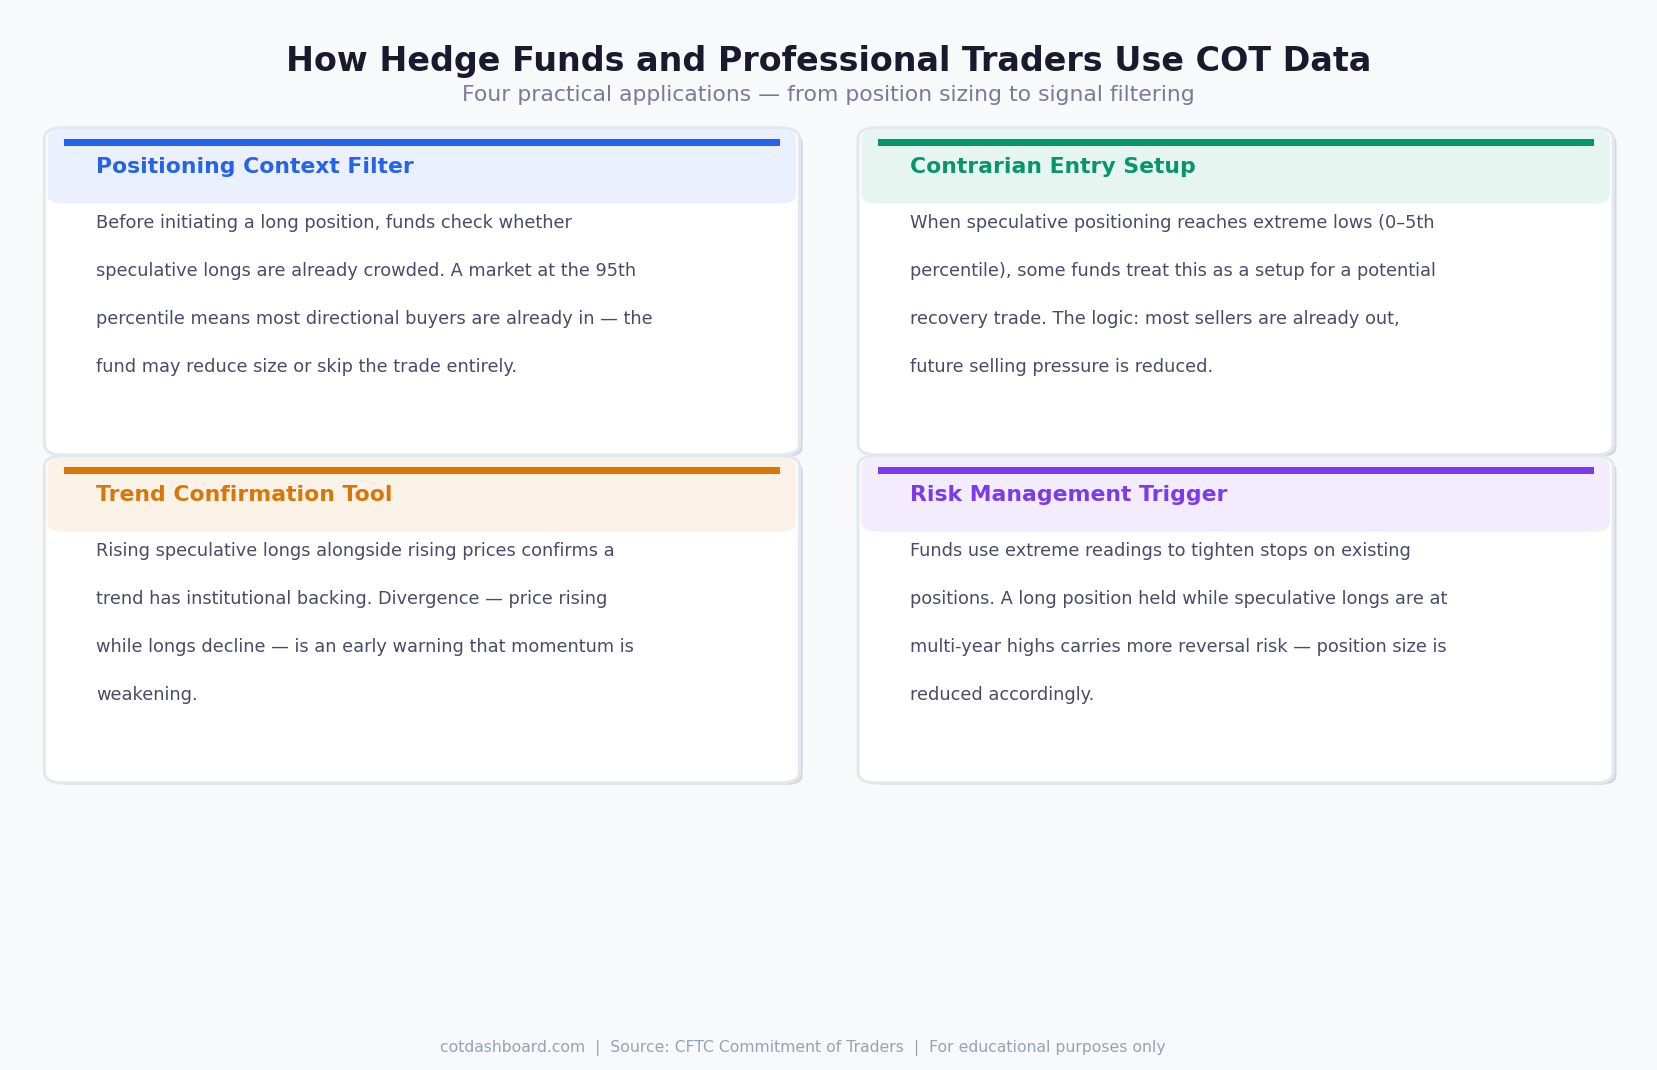
Professional traders using COT data are typically looking at one of four things: crowding context, contrarian setups, trend confirmation, or risk triggers. None of these generates a standalone trade entry.
Application 1: Crowding Filter
The most common use of COT data in institutional settings is as a positioning filter — a check on whether a trade idea is swimming with or against the crowd.
Before adding a long position in a commodity, a fund might check the current non-commercial net position percentile. If speculative longs are already at the 95th percentile, the trade is being initiated into a crowded market. Most of the directional buyers are already in. The risk/reward is less favourable.
This does not mean the trade is wrong. It means the fund might reduce position size, require a stronger fundamental thesis, or wait for positioning to normalise before entering.
The filter is applied as a pre-trade check, not a signal. The COT reading alone does not generate the trade — it modifies it.
Application 2: Contrarian Setup Identification
Some systematic funds and macro traders track COT extremes as part of a contrarian framework.
The logic: when speculative positioning reaches multi-year lows (bottom 5th percentile), most sellers have already exited. The market is under-owned by speculators. A small positive catalyst can trigger rapid repositioning as funds rebuild exposure.
This is most commonly applied in commodity markets where positioning cycles are well-documented — crude oil, gold, agricultural products. It is less reliable in financial futures where macro regimes can justify sustained extremes.
Even here, COT extremes are not entry triggers. They are conditions that make a contrarian thesis more structurally sound.
Application 3: Trend Confirmation
COT data can confirm or contradict a price trend.
If prices are rising and speculative longs are also rising, institutional momentum is backing the move. The trend has participation. This is a supporting condition for staying long.
If prices are rising but speculative longs are declining or flat — divergence — that is a warning that the price move is not backed by fresh institutional buying. The trend may be losing conviction.
Divergence signals of this type are tracked systematically by some trend-following funds as part of their position review process. A sustained divergence often precedes a correction or reversal.
Application 4: Risk Management Trigger
Extreme COT readings are used by some funds to trigger risk management actions on existing positions — not new entries.
A fund already long crude oil that sees speculative longs reach a 5-year high might:
- Move stop-loss orders closer to the current price
- Reduce position size by 25–50%
- Buy put options as downside protection
None of these is an outright exit. The fund is not necessarily wrong to be long — but the risk profile has changed because the trade is now more crowded. Managing that crowding risk is prudent.
What Hedge Funds Do Not Do With COT Data
They do not use it for entry timing. "COT is extreme, therefore sell now" does not work reliably. The signal has too much timing variance.
They do not use it in isolation. COT data is one input. Macro fundamentals, price action, volatility structure, and positioning across related markets all inform the same decision.
They do not treat it as predictive. The COT report describes where positioning is now, not where price will go. Funds that treat extremes as precise predictions of reversal quickly learn the lesson that crowded trades can get more crowded.
The Percentile Rank Approach
The most consistent institutional use of COT data centres on percentile ranks rather than raw contract numbers.
Raw positions are not comparable across markets or across time. A net long position of 200,000 contracts in crude oil carries completely different implications from 200,000 contracts in wheat. Absolute numbers are almost meaningless without context.
Percentile ranks normalise this. A 90th percentile reading in any market means the same thing: positioning is more extreme than in 90% of historical periods. This makes cross-market comparisons valid and consistent.
The cotdashboard.com platform uses a 104-week (2-year) rolling percentile window. This captures recent positioning cycles while excluding very old data that may no longer reflect current market structure.
For related reading, see Do Extreme COT Positions Predict Reversals? and Commercial vs Non-Commercial Traders: What's the Difference?