Understanding COT Data for Bond Markets
Feb 14, 2026
US Treasury futures are the largest financial futures market in the world by open interest and notional value. The COT report for Treasury futures offers a window into how large speculators — primarily macro hedge funds and CTA trend-followers — are positioned along the US yield curve.
This guide covers the four Treasury futures we track, explains how bond positioning differs from commodity positioning, and identifies the patterns worth understanding before reading this data.
The Four Treasury Futures We Track
All four are CBOT-listed interest rate futures. Each contract represents a different point on the US yield curve.
| Symbol | Market | CFTC Code | Contract Size | Notional (approx) |
|---|---|---|---|---|
| ZT | 2-Year Treasury Note | 042601 | $200,000 face | ~$200,000 |
| ZF | 5-Year Treasury Note | 044601 | $100,000 face | ~$100,000 |
| ZN | 10-Year Treasury Note | 043602 | $100,000 face | ~$100,000 |
| ZB | 30-Year Treasury Bond | 020601 | $100,000 face | ~$100,000–$150,000 |
Note: Because Treasury prices change as interest rates change, the actual notional exposure per contract varies. The 30-Year bond has much higher duration (price sensitivity per basis point) than the 2-Year note. A net position of 50,000 contracts in 30Y bonds represents far more interest rate risk than 50,000 contracts of 2Y notes.
How Bond Futures Positioning Works
Bond positioning is expressed in terms of price direction, not yield direction. This requires a translation step that commodity traders sometimes miss:
- Net Long bonds = expecting prices to rise = expecting yields to fall = rate-cut or safe-haven positioning
- Net Short bonds = expecting prices to fall = expecting yields to rise = rate-hike or risk-on positioning
At extreme net short readings in Treasury futures, large speculators are collectively positioned for higher interest rates (lower bond prices). At extreme net long readings, they are positioned for lower rates (higher bond prices).
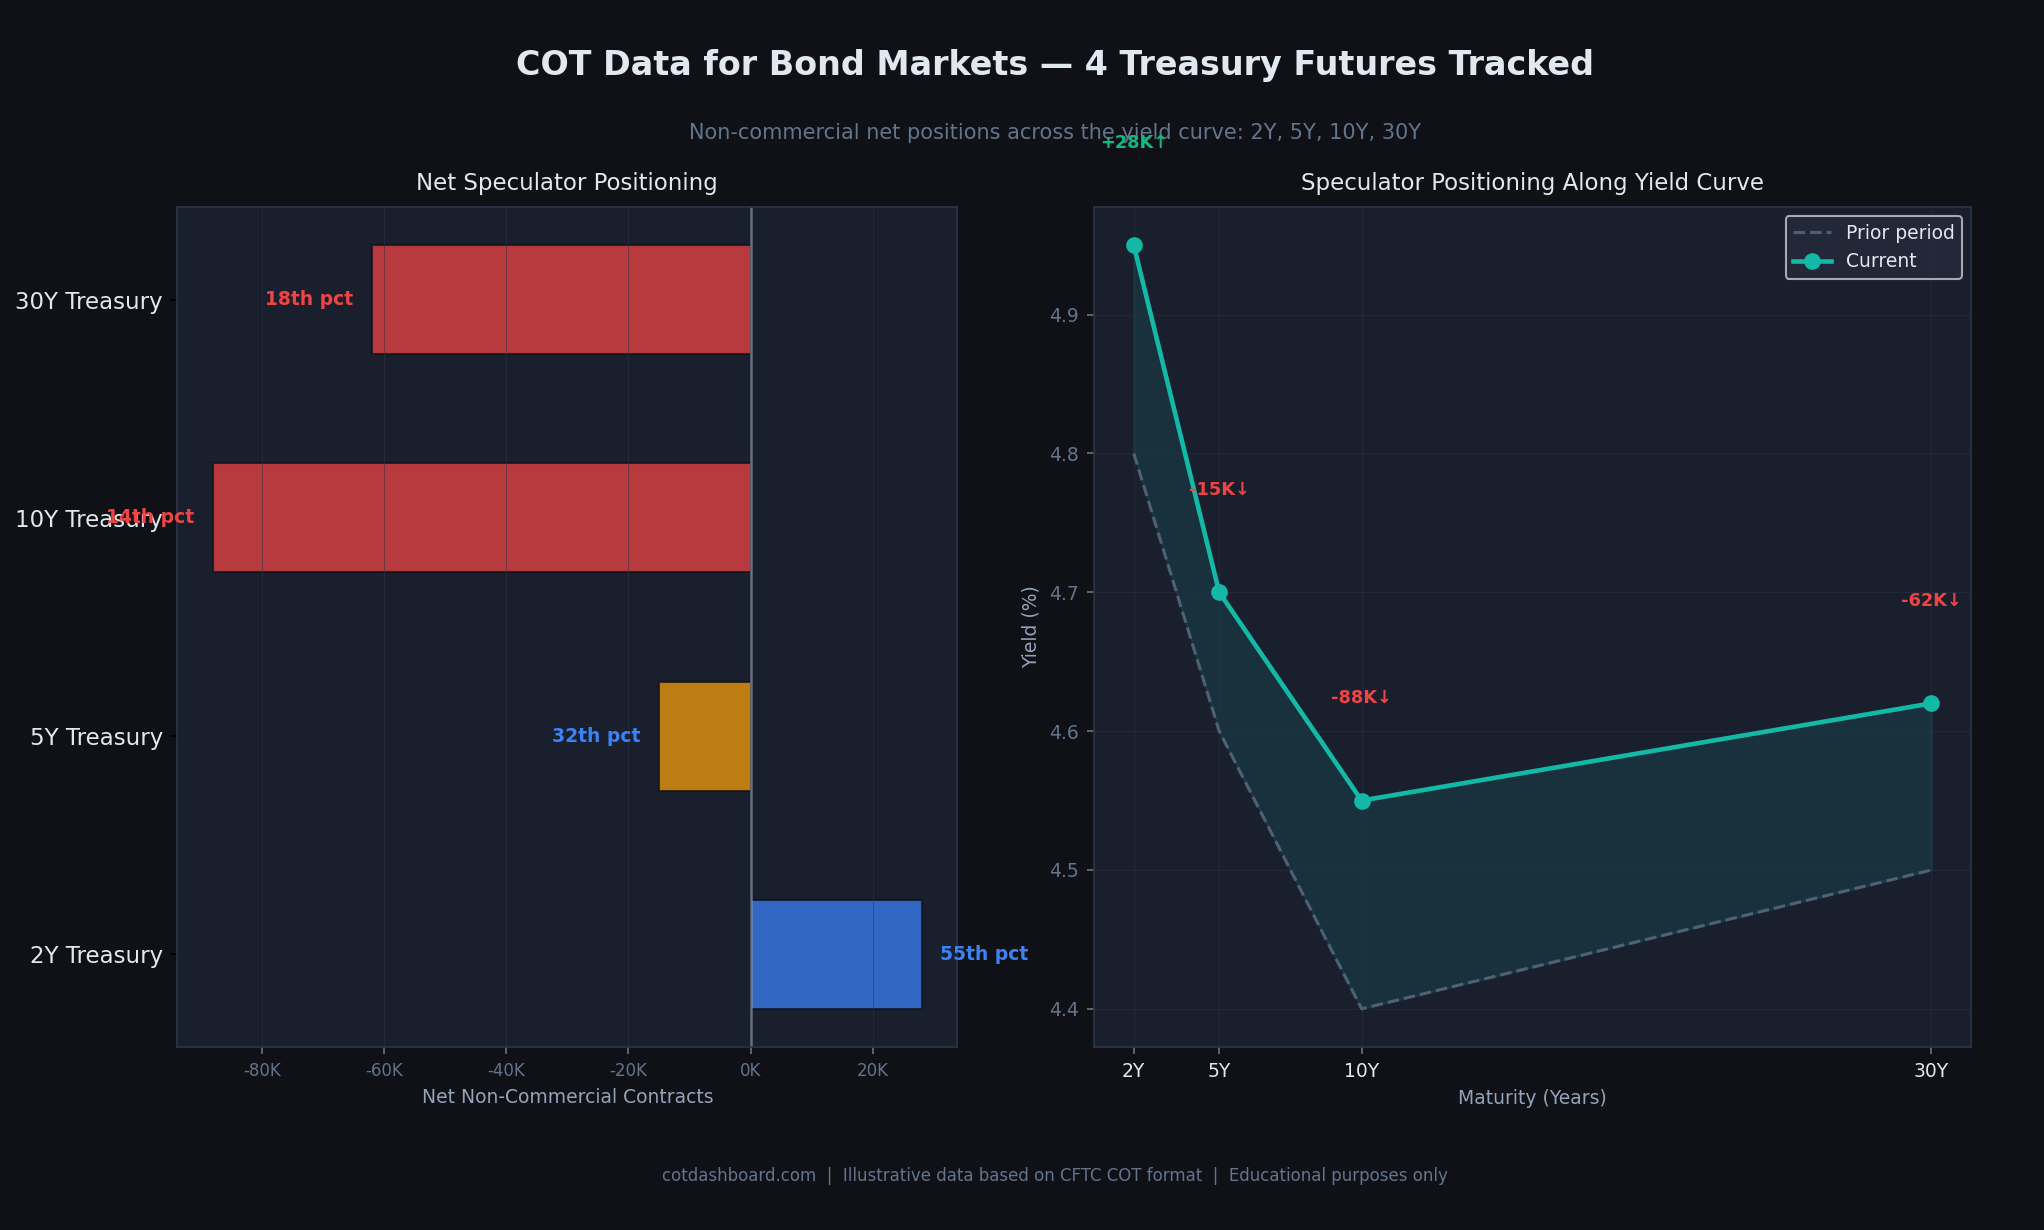
Left: current net positions and percentile ranks across 2Y, 5Y, 10Y, and 30Y Treasury futures. Right: the yield curve with each maturity labelled by the direction of speculative positioning — green annotations indicate net long, red indicate net short.
Reading the Yield Curve from COT Data
The four Treasury futures together provide a picture of how speculators are positioned across the entire yield curve. This creates several informative configurations:
All four net short (bear steepener/flattener views): Speculators across the entire curve are betting on higher rates. This is common in rate-hiking cycles.
Short at the long end, neutral or long at the short end (steepener): Speculators expect long-term yields to rise relative to short-term yields — a steepening of the yield curve. This often reflects expectations of stronger growth or higher inflation in the future.
Long at the short end, short at the long end (flattener): Speculators expect the short end to be supported (by central bank policy) while the long end rises. Or they expect long-term yields to rise independently. This is a yield curve flattening trade.
All four net long: Speculators across the curve expect lower rates. This is common in periods of recessionary concern, financial stress, or when the market prices aggressive rate cuts.
Duration Matters When Comparing Positions
A direct comparison of contract counts between the 2Y and 30Y futures is misleading without adjusting for duration.
The 10-Year Treasury note has roughly six times the price sensitivity per contract of the 2-Year note. The 30-Year bond has even more. This means:
- A 100,000-contract net short in the 30Y bond represents a much larger economic position (rate-rise bet) than 100,000 contracts net short in the 2Y note.
- When comparing positioning "extremes" across maturities, the percentile rank is a better comparative tool than the raw contract count — it normalises each market against its own history.
Our dashboard reports net contracts and percentile ranks. For a proper duration-adjusted analysis of total Treasury positioning, you would need to weight each contract by its DV01 (dollar value of a basis point), which is beyond the scope of this dataset.
What Drives Treasury Futures Positioning
Three main forces drive speculative positioning in Treasury futures:
Federal Reserve policy expectations. The most powerful driver. When markets price in rate hikes, net short positioning in Treasuries tends to build. When rate cuts are expected, net long positioning builds.
Inflation data. Surprise inflation readings cause rapid repositioning, especially in the long end of the curve (5Y, 10Y, 30Y), where inflation expectations have the largest impact on yield.
Risk-on / Risk-off sentiment. Treasuries are a safe-haven asset. During equity market stress, speculative short positioning in Treasuries can unwind quickly as traders seek lower-risk holdings — even if the macro rate outlook has not changed.
The Commercial Side in Bond Markets
In Treasury futures, commercial traders are primarily financial institutions managing interest rate exposure on their balance sheets — banks, insurance companies, pension funds. Their hedging behaviour differs from commodity commercials (who hedge physical inventory).
Treasury commercials are large, constant hedgers. Their positions reflect asset-liability management rather than directional views on rates. This makes the non-commercial (speculative) positioning relatively more informative in Treasury markets compared to some commodity markets where the commercial/non-commercial distinction is less clean.
Limitations Specific to Bond Markets
Duration mismatch makes cross-maturity comparison difficult. As covered above, comparing raw contract counts across maturities without duration adjustment is imprecise. Use percentile ranks for cross-maturity comparison.
US Treasury positioning does not represent global bond markets. COT data covers CBOT-listed US Treasury futures. The positioning does not reflect views on European, UK, or Japanese government bonds. Global rate differentials (which often drive currency positioning) are therefore only partially visible through this dataset.
Very large open interest means small percentage changes look small. The 10Y Treasury futures contract regularly has open interest exceeding 4 million contracts. A 50,000-contract shift in net positioning is roughly 1% of open interest — meaningful, but it represents a small fraction of total positioning compared to the same number in a market like Platinum.
Intraday positioning is not captured. The COT report shows Tuesday closing positions, reported Friday. Rapid intraweek repositioning around major data releases (CPI, FOMC decisions) is not visible in this weekly snapshot.
Related Pages
- What Is the COT Report? — foundation reading
- How to Read COT Data — column-by-column walkthrough
- What Are Percentile Rankings? — how positions are ranked vs history
- Commercial vs Non-Commercial Traders — who the hedgers and speculators are in bond markets
- Understanding COT Data for FX Markets — interest rates and currencies are closely linked
- COT Data Limitations — what the weekly data cannot tell you
- How Hedge Funds Use COT Data — practical applications of positioning data
- COT Glossary — key terms defined
- Interactive Dashboard — current bond positioning data