Understanding COT Data for FX (Currency) Markets
Feb 17, 2026
Currency futures are the most actively followed category in the COT report. Fund managers, macro traders, and analysts use CFTC positioning data to gauge whether large speculators are building or unwinding directional bets on major currencies.
This guide covers the nine FX markets in our dashboard, explains how the commitment of traders report forex data is structured, and clarifies a few quirks specific to currency positioning.
Contents
- The Nine Currency Pairs We Track
- How FX COT Positioning Works
- Commercials vs Non-Commercials in FX
- What the Data Looks Like
- Per-Pair Breakdown
- Historical Patterns in FX Positioning
- Reading Extremes in FX
- How We Report FX Data
- Limitations Specific to FX
The Nine Currency Pairs We Track
All nine pairs are CME-listed futures. Each is quoted as units of the foreign currency versus the US Dollar.
| Symbol | Market | CFTC Code | Typical Contract Size |
|---|---|---|---|
| EUR | Euro FX | 099741 | 125,000 EUR |
| GBP | British Pound | 096742 | 62,500 GBP |
| JPY | Japanese Yen | 097741 | 12,500,000 JPY |
| CAD | Canadian Dollar | 090741 | 100,000 CAD |
| CHF | Swiss Franc | 092741 | 125,000 CHF |
| AUD | Australian Dollar | 232741 | 100,000 AUD |
| MXN | Mexican Peso | 095741 | 500,000 MXN |
| BRL | Brazilian Real | 102741 | 100,000 BRL |
| NZD | New Zealand Dollar | 112741 | 100,000 NZD |
EUR and JPY are the most widely watched. The EUR has the highest open interest among G10 pairs. The JPY frequently produces the most dramatic positioning swings.
How FX COT Positioning Works
All currency futures on the CME are quoted against the US Dollar. A net long position in EUR futures means non-commercial traders hold more buy contracts (long EUR / short USD) than sell contracts (short EUR / long USD).
This creates an embedded USD relationship in every FX positioning reading.
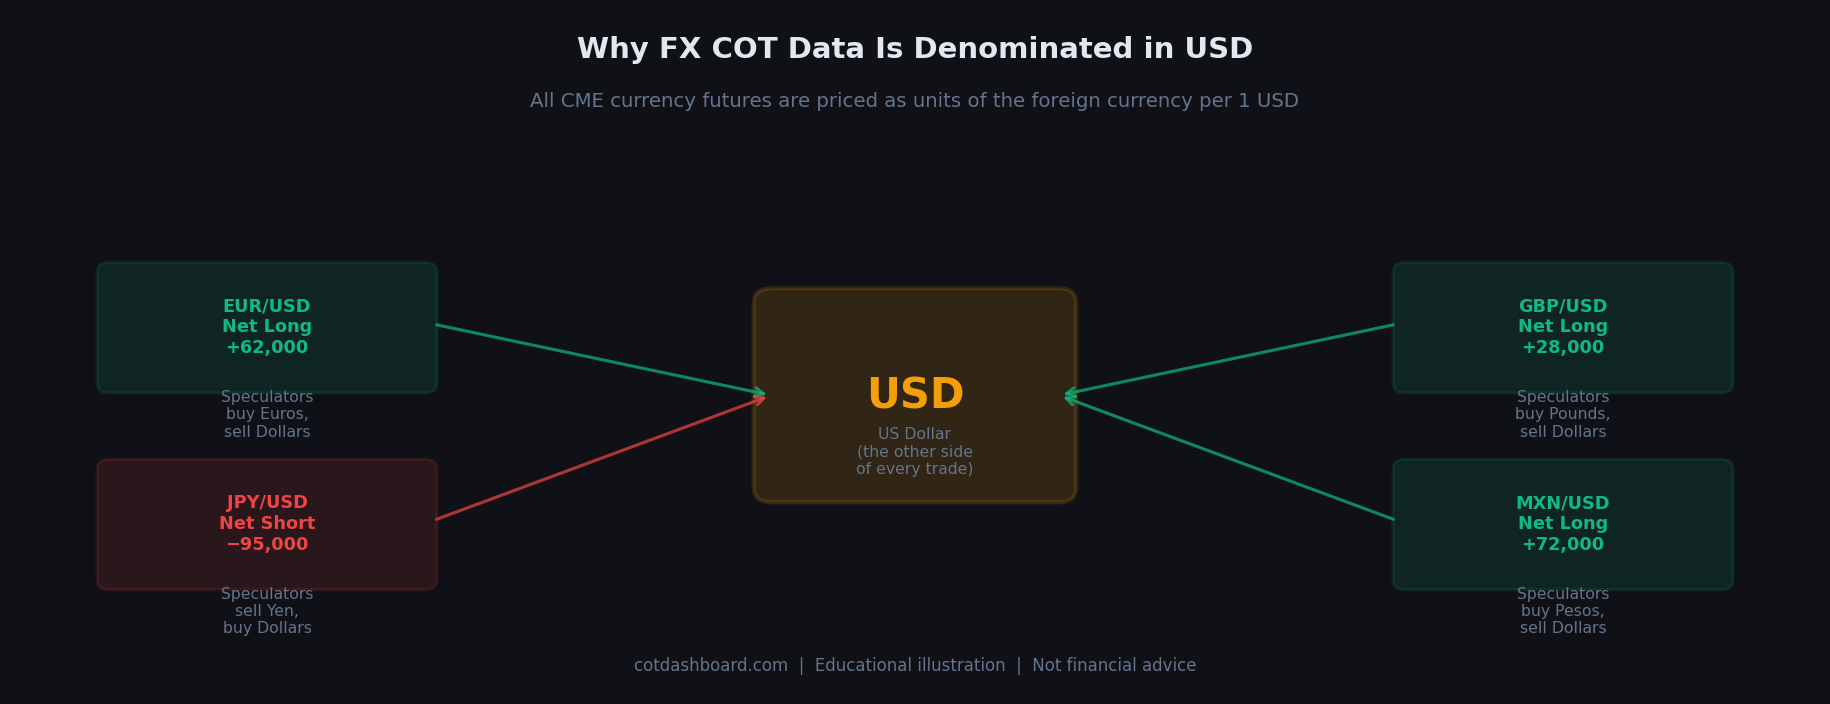
Every long position in a currency future is simultaneously a short on USD. Reading multiple pairs together gives an aggregate picture of USD sentiment.
For example:
- Net long EUR + net long GBP + net long AUD all point in the same direction: dollar bearishness.
- If the JPY is simultaneously net short, it partially offsets the implied dollar picture (being short JPY means being long dollars on that leg).
Reading currency positioning in isolation has limited value. Looking at the pattern across all nine pairs gives a clearer picture of aggregate USD sentiment at any given time.
The Commercial vs Non-Commercial Split in FX
In commodity markets, commercial traders are typically producers or end-users hedging physical exposure. In currency markets, the distinction is less clean.
Commercial traders in FX include:
- Multinational corporations hedging foreign revenue
- Banks managing currency exposure from international operations
- Asset managers with known foreign currency liabilities
Non-commercial traders include:
- Macro hedge funds with directional currency views
- Commodity Trading Advisors (CTAs) running trend-following strategies
- Proprietary trading firms
We focus on non-commercial positioning because it represents the speculative, directional part of the market. Commercial hedgers tend to move in response to business needs. Speculative positioning reflects market expectations.
What the Data Looks Like: A Snapshot
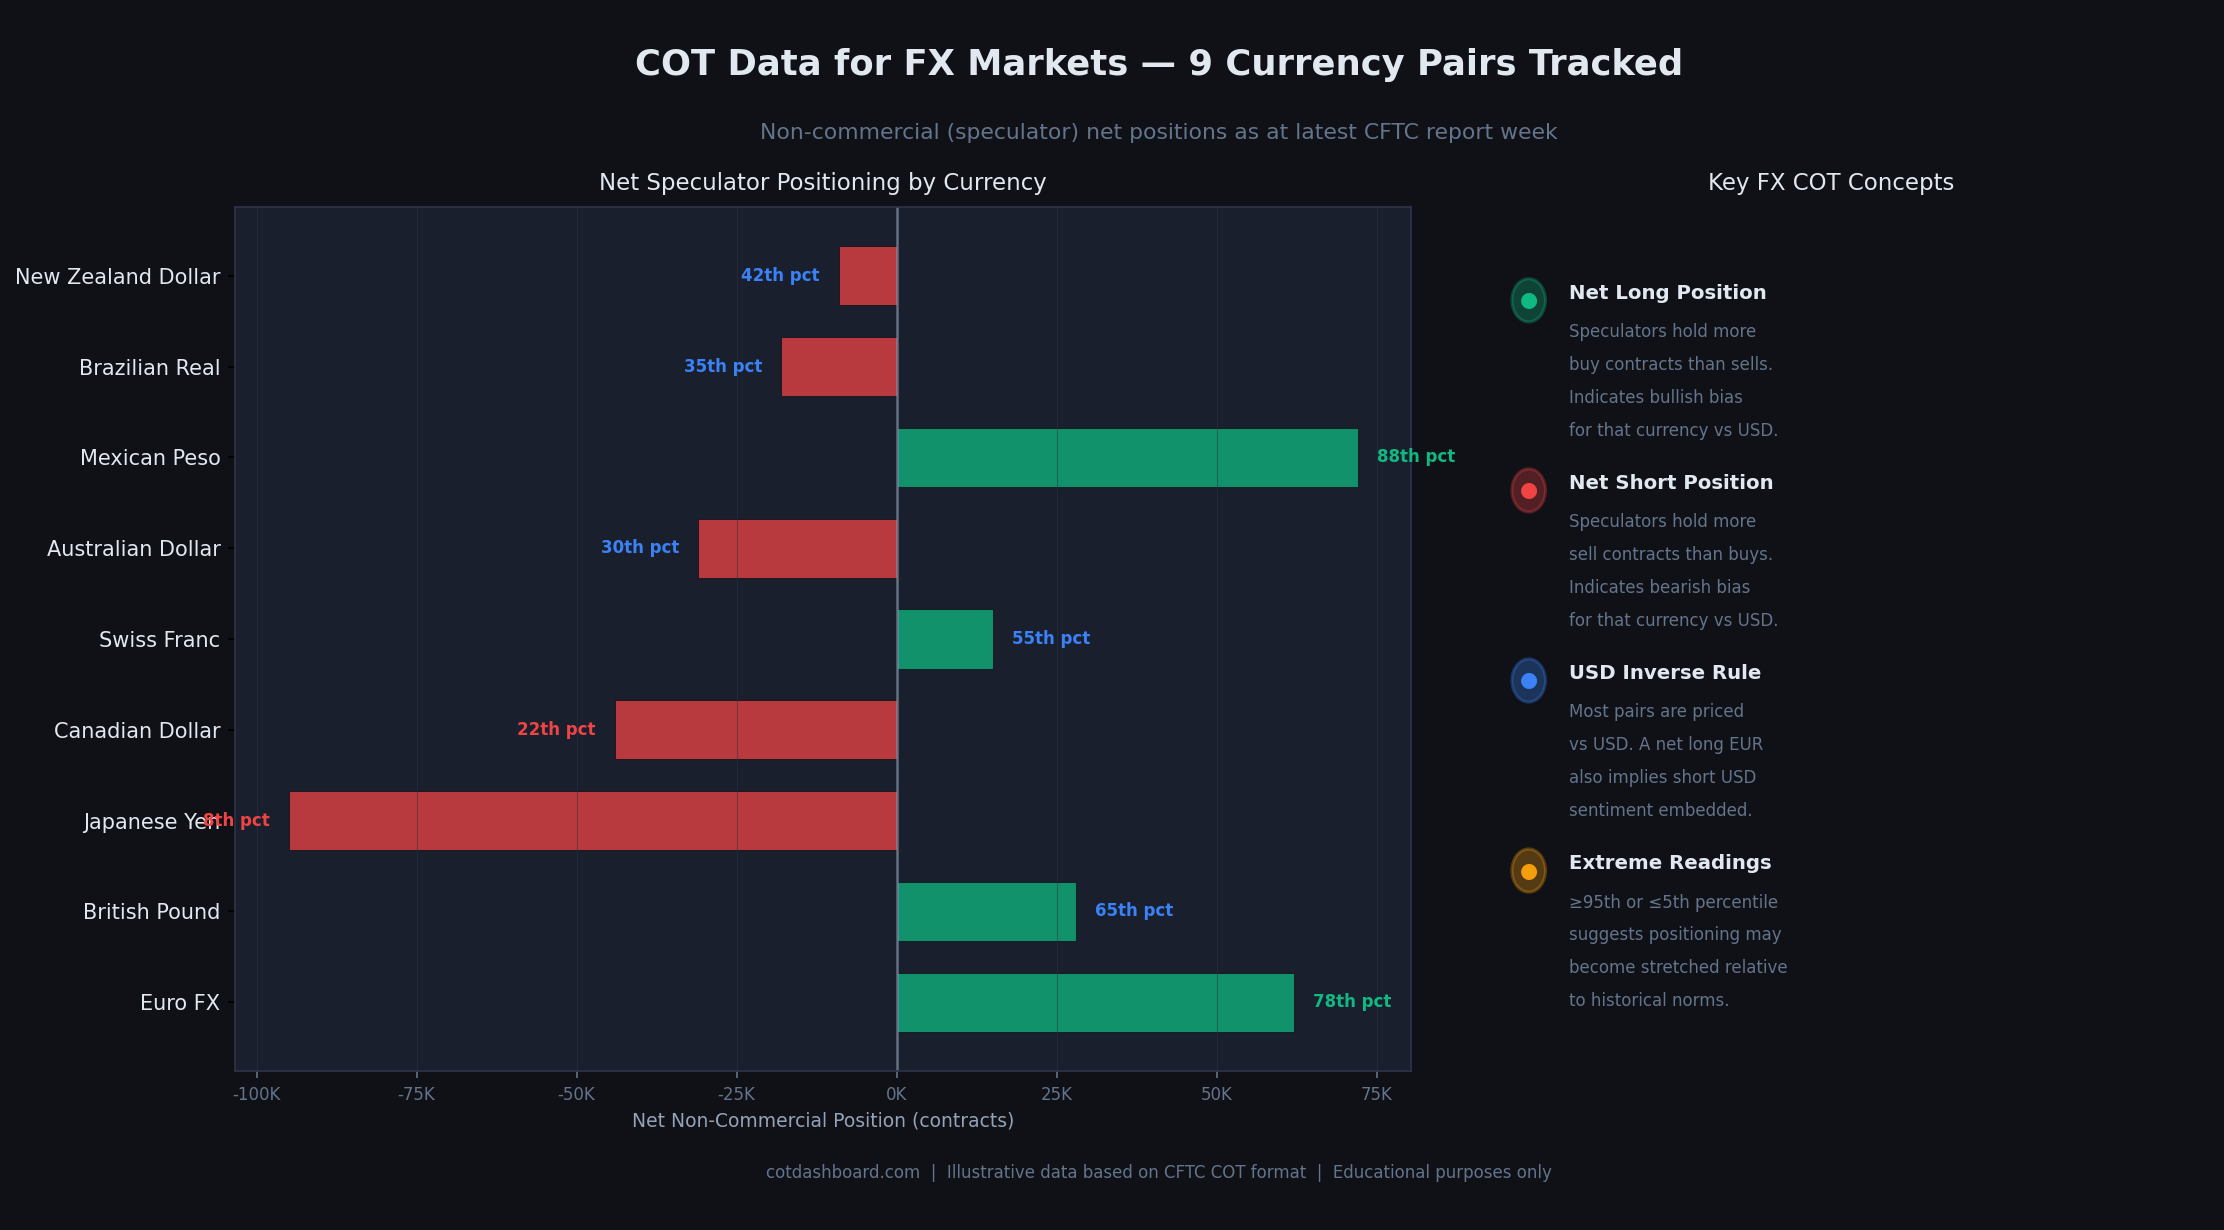
Illustrative snapshot. Green bars = net long (bullish currency, bearish USD). Red bars = net short (bearish currency, bullish USD). Percentile labels show where each reading sits versus the 104-week history.
A few things to note:
- The absolute size of bars is not directly comparable across currencies. A 95,000 contract short in JPY does not equal a 95,000 contract short in EUR in notional USD terms, because contract sizes differ.
- What matters more is the percentile rank — where that position sits relative to historical norms for that specific pair.
- When multiple pairs simultaneously show readings above the 80th percentile (long) or below the 20th percentile (short), it is a sign of broad-based USD directional consensus among large speculators.
Per-Pair Breakdown
Each currency has its own positioning characteristics. Below is a brief profile of what to watch in each market.
EUR/USD — Euro FX COT Report
The EUR/USD COT report is the most closely watched FX positioning dataset. The Euro future has the highest open interest of any currency pair and effectively functions as the inverse of the DXY (US Dollar Index) in speculative positioning terms.
Extreme net long EUR readings generally indicate a consensus dollar-bearish view among large speculators. Extreme net short readings indicate the reverse. Because EUR dominates the DXY basket (~58% weight), EUR COT data is often used as a proxy for overall USD sentiment.
CFTC Code: 099741 | Contract size: 125,000 EUR
GBP/USD — British Pound COT Report
GBP positioning tends to be more volatile than EUR, reflecting the pound's sensitivity to UK-specific political and economic events. The GBP COT report is useful for tracking how speculators are positioned around Bank of England policy shifts and domestic macro data.
Net positions in GBP are typically smaller in absolute contract terms than EUR, but percentage moves in positioning can be larger. Watch for divergences between EUR and GBP positioning — when EUR is net long but GBP is net short, speculators are differentiating between EU and UK outlooks.
CFTC Code: 096742 | Contract size: 62,500 GBP
JPY/USD — Japanese Yen COT Report
The JPY COT report is particularly useful for tracking carry trade positioning. The Yen frequently shows the most extreme short positioning of any G10 currency during periods of low global volatility, when speculators borrow in low-rate currencies to fund higher-yielding positions elsewhere.
When risk appetite deteriorates sharply, JPY shorts unwind rapidly. Extreme net short Yen readings — above the 90th percentile — are watched closely by macro traders as a potential crowding indicator.
CFTC Code: 097741 | Contract size: 12,500,000 JPY
AUD/USD — Australian Dollar COT Report
The AUD COT report is one of three commodity currency pairs alongside CAD and NZD. Australian Dollar positioning correlates with commodity sentiment, particularly metals and mining. Net long AUD readings often coincide with periods of positive risk appetite and rising commodity prices.
Watch AUD positioning alongside CAD and NZD. When all three move in the same direction, it usually reflects a broad commodity or risk theme rather than an Australia-specific view.
CFTC Code: 232741 | Contract size: 100,000 AUD
CAD/USD — Canadian Dollar COT Report
CAD positioning is heavily influenced by crude oil prices, given Canada's status as a major oil exporter. The Canadian Dollar COT report is useful for cross-referencing against crude oil COT data — if crude oil speculators are net long but CAD speculators are net short simultaneously, that is a divergence worth examining.
CAD tends to have lower absolute positioning levels than EUR or JPY but can show sharp week-over-week changes around Bank of Canada decisions or oil supply events.
CFTC Code: 090741 | Contract size: 100,000 CAD
CHF/USD — Swiss Franc COT Report
CHF is a safe-haven currency. Swiss Franc COT positioning tends to build net longs during periods of global stress and unwind during risk-on periods. This makes the CHF COT report a useful cross-check against equity and bond positioning.
Extreme net long CHF readings are relatively rare outside of genuine risk-off environments. When they appear, they indicate that large speculators are seeking defensive positioning.
CFTC Code: 092741 | Contract size: 125,000 CHF
NZD/USD — New Zealand Dollar COT Report
NZD behaves similarly to AUD and often moves in tandem. The New Zealand Dollar COT report is most useful when NZD and AUD diverge — this can reflect specific Reserve Bank of New Zealand policy expectations or NZ-specific data deviating from the broader commodity currency trend.
NZD has the smallest open interest of the G10 pairs we track. Absolute position sizes are smaller, and percentage positioning moves can be more extreme.
CFTC Code: 112741 | Contract size: 100,000 NZD
MXN and BRL — Emerging Market Pairs
The Mexican Peso and Brazilian Real COT reports follow a different pattern than G10 pairs. Both are classified as emerging market currencies with lower liquidity.
Key differences:
- Positioning extremes can persist longer. EM carry trades are slower to unwind than G10 positions.
- Unwinding is faster when it happens. When EM risk sentiment shifts, MXN and BRL positioning can move sharply in a single week.
- US-Mexico and US-Brazil relations influence MXN and BRL positioning independently of broader USD trends.
We track both pairs on the dashboard but apply extra caution when interpreting extremes relative to G10 pairs.
MXN CFTC Code: 095741 | Contract size: 500,000 MXN
BRL CFTC Code: 102741 | Contract size: 100,000 BRL
Historical Patterns in FX Positioning
A few recurring patterns are worth understanding when conducting COT analysis for forex markets:
The JPY carry trade signal. The Yen often shows the most extreme short positioning of any G10 currency during low-volatility periods. When risk appetite deteriorates, JPY shorts unwind rapidly. Net short Yen readings above the 95th percentile have historically coincided with crowded carry positioning.
Euro as proxy for dollar sentiment. EUR is the largest currency future by open interest and effectively acts as the inverse of the DXY in positioning terms. Extreme net long EUR generally reflects a consensus dollar-bearish view.
Commodity currency correlation. AUD, CAD, and NZD tend to show correlated positioning during commodity cycles. All three may build long positions simultaneously during commodity booms and flip together during downturns.
EM pair caution. MXN and BRL have lower liquidity than G7 pairs. Positioning extremes in these two can persist longer and unwind faster than in the majors.
Reading Extremes in FX
Extreme percentile readings — 95th or above, 5th or below — in currency markets are worth noting, but come with a caveat: FX trends can last longer than positioning models suggest.
A 99th percentile net short in JPY might reflect a multi-year structural theme such as an ongoing interest rate differential, rather than a crowded trade about to reverse. Context matters.
What extreme FX readings are more reliably useful for:
- Identifying when a trend has attracted maximum speculative participation
- Spotting divergences between two correlated pairs (e.g., AUD and NZD moving in opposite directions)
- Comparing current extremes against previous instances of similar readings
What they are less useful for:
- Timing reversals with precision
- Trading against a strong macro trend supported by fundamentals
How We Report FX Data
In the dashboard, FX pairs are listed as a group under the "FX" category filter. Each row shows:
- Net position (non-commercial long minus short, in contracts)
- Weekly change (net change from the prior report)
- Open interest (total outstanding contracts, all trader types)
In our weekly COT report analysis, FX positioning receives its own section with percentile ranks and comparisons to moving averages across all nine pairs.
Limitations Specific to FX Data
Cross-rate implications are not shown. Our data shows each pair versus USD only. EUR/JPY or AUD/JPY positioning is not available directly from the legacy COT report.
Spot and OTC FX is not included. The CFTC report covers regulated futures only. The much larger over-the-counter FX market — banks, retail brokers — is not reported here.
Contract size differences. Comparing notional positioning across pairs requires adjusting for contract size and current exchange rates. The dashboard shows contract counts, not notional USD values.
Related Pages
- What Is the COT Report? — start here if you are new to COT data
- How to Read COT Data — column-by-column breakdown
- What Are Percentile Rankings? — how we rank positions vs history
- Commercial vs Non-Commercial Traders — who the hedgers and speculators are in FX futures
- Do Extreme COT Positions Predict Reversals? — especially relevant for JPY carry trade extremes
- How Hedge Funds Use COT Data — macro funds are the primary users of FX COT data
- COT Data Limitations — what the weekly data cannot tell you
- COT Glossary — definitions for open interest, commercial, non-commercial
- Interactive Dashboard — view live FX positioning data