Gold COT Report: How to Read Speculative Positioning in Gold
Feb 23, 2026
Gold futures (COMEX: GC) consistently attract more speculative interest than any other commodity in the CFTC Commitment of Traders report. The net position of large speculators in gold is watched closely by macro traders, FX analysts, and central bank watchers — partly because gold positioning often moves in sync with real interest rate expectations and USD sentiment.
This guide explains the gold COT report: what the data shows, what drives it, how to interpret extremes, and what the commercial side of the market tells you.
The Gold Futures Contract We Track
| Detail | Value |
|---|---|
| Exchange | COMEX (CME Group) |
| Symbol | GC |
| CFTC Code | 088691 |
| Contract Size | 100 troy ounces |
| Notional (approx at $2,800/oz) | ~$280,000 per contract |
| Settlement | Physical delivery (most positions rolled before delivery) |
The notional value per contract changes with the gold price. At higher gold prices, the same number of contracts represents a larger dollar exposure. Our dashboard shows contract counts — not notional USD — so keep this in mind when comparing gold positioning across periods with very different price levels.
How Gold Futures Positioning Works
Gold positioning follows a fairly consistent structure in the COT report:
- Large speculators (non-commercial): Hedge funds, CTAs, and macro traders. Predominantly net long. They drive most of the positioning swings.
- Commercial traders: Primarily gold producers (miners who hedge future output) and dealers. Almost always net short, offsetting the speculative long side.
- Small speculators (non-reportable): Retail and small fund traders. Usually net long but much smaller in scale.
The speculator net position is the number to watch. Gold speculators are structurally long — they rarely go net short. The more informative signal is how far above or below the historical average the current net long position sits.
Reading the Gold COT Report
The key numbers in any gold COT report row:
Non-commercial net position: Speculator longs minus speculator shorts. A reading of +200,000 means large speculators hold 200,000 more long contracts than short. This is the primary indicator.
Weekly change: How much the net position moved from the prior week. Large week-on-week changes — say, ±30,000 contracts or more — are worth noting. They suggest meaningful repositioning, often in response to macro data or a price breakout.
Open interest: Total outstanding contracts across all participant categories. Rising open interest alongside rising prices suggests new money entering on the long side — a bullish configuration. Rising open interest alongside falling prices suggests new short positions — bearish.
Percentile rank: Where the current net long position sits relative to the past two years of data. A percentile of 90 means speculators are more net long than they have been 90% of the time in that window. This is more useful than the raw contract number because gold's open interest changes over time.
What Drives Gold Speculative Positioning
Real interest rates. The strongest driver of gold COT positioning. When US real rates (nominal rates minus inflation expectations) fall, gold becomes relatively more attractive as a non-yielding asset. Speculative longs build. When real rates rise, speculative positioning in gold typically contracts — even if the gold price itself has not moved sharply yet.
USD direction. Gold is priced in dollars. A weaker dollar tends to attract speculative buying in gold futures. COT positioning in gold often moves inversely with USD positioning in the FX section of the same report. Checking both together gives a more complete picture.
Risk-off sentiment. During periods of equity market stress or geopolitical uncertainty, gold attracts safe-haven buying. This can build speculative longs quickly, sometimes without a change in the rate or dollar backdrop.
Fed policy expectations. When markets price in rate cuts, speculative gold longs tend to increase. When rate hikes are expected, positions contract. The relationship is not mechanical — timing varies — but the directional link is consistent.
Central bank buying. Not directly visible in the CFTC report (central banks do not trade COMEX futures), but large sustained periods of central bank physical gold purchases can support the price floor that makes speculative long positions more attractive to hold.
Extreme Positioning in Gold: What It Has Historically Meant
Gold speculators reach extremes on both sides, though "extreme long" is far more common than "extreme short" given the structural long bias.
Extreme net long (high percentile rank): Speculators are crowded on the long side. This does not predict an immediate reversal — crowded trades can remain crowded for weeks or months. But it does mean the long side is vulnerable to rapid unwinding if a catalyst appears (a surprise Fed statement, a sharp USD rally). Extreme long readings have historically preceded short-term consolidations or pullbacks more often than continued rallies.
Low or near-zero net long (low percentile rank): Speculative interest in gold has been washed out. The long side is relatively light. Historically, these periods have coincided with price lows or preceded price recoveries — not because the data predicts direction, but because low speculative positioning means there is less selling pressure from long liquidation.
Net short (rare): Speculators are collectively short gold. This has occurred only a handful of times in the past decade, typically during sharp USD rallies or aggressive Fed tightening cycles. When it has happened, it has often — though not always — marked a sentiment extreme.
None of these are trading signals on their own. Positioning data adds context to a price and macro view — it does not replace one.
The Commercial Side in Gold Markets
Gold commercials (producers and dealers) are almost always net short. This reflects genuine hedging: a gold miner who expects to produce 100,000 ounces over the next year may sell futures to lock in the current price. This is not a directional bet — it is inventory management.
Because commercial hedging is structural and large, the commercial net position by itself tells you less about future direction than it does in some other commodity markets. What is more informative is a significant shift in commercial hedging activity: if commercials are adding shorts at a faster-than-usual rate, they may be locking in what they consider elevated prices. If they are reducing shorts, they may be less motivated to hedge at current levels.
Limitations Specific to Gold COT Data
COMEX is not the only gold market. COMEX gold futures represent a large portion of global gold futures trading, but OTC gold markets (London forwards, unallocated gold trading between banks) are much larger in notional terms and are not reported in the CFTC data. Speculative positioning on COMEX is a partial picture.
ETF flows are separate. Gold ETF holdings (such as SPDR Gold Shares) represent physical gold demand and are not captured in the CFTC futures report. A divergence between rising COMEX net longs and falling ETF holdings — or vice versa — is sometimes meaningful and worth checking separately.
Central bank activity is invisible. Central banks accumulate physical gold but do not trade COMEX futures. Large central bank purchases can support prices without showing up as speculative positioning.
The two-year percentile window has limits. Our percentile rankings use a rolling two-year history. If the past two years have been unusually bullish or bearish for gold, the percentile reading is calibrated to that period. A "90th percentile net long" in a bullish two-year window may be a lower absolute level than a 90th percentile reading from a different two-year window.
Gold COT Data: Current and Historical
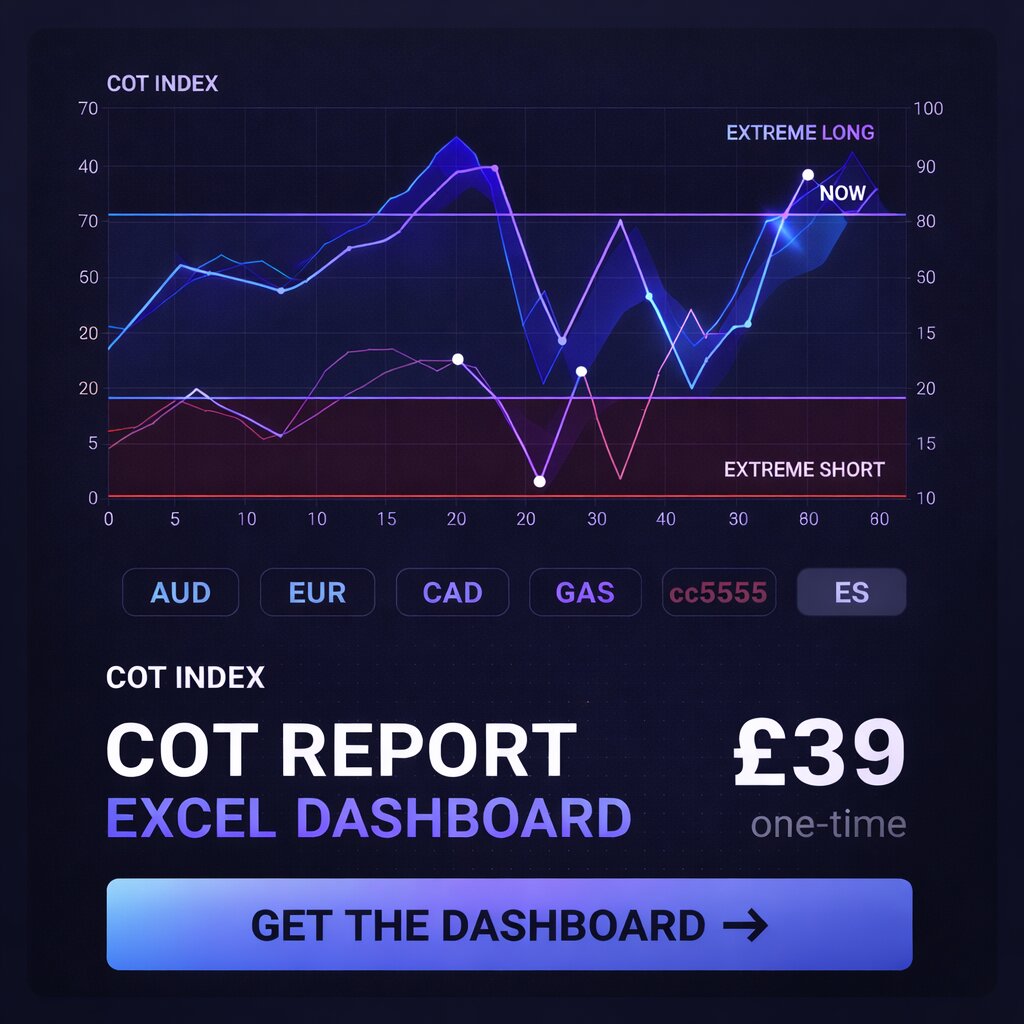
Our interactive dashboard shows the latest gold COT report figures, including net speculator position, weekly change, open interest, and percentile rank — updated every Friday after the CFTC release.
For historical context and weekly analysis of gold positioning alongside the other 40 markets we track, see the Weekly COT Analysis posts, published each week after the Friday data release.
Related Pages
- What Is the COT Report? — foundation reading
- How to Read COT Data — column-by-column walkthrough
- What Are Percentile Rankings? — how positions are ranked vs history
- COT Data for Metals Markets — silver, platinum, palladium alongside gold
- Commercial vs Non-Commercial Traders — who the hedgers and speculators are
- Do Extreme COT Positions Predict Reversals? — a detailed look at what extreme gold positioning has historically meant
- COT Data Limitations — what the weekly data cannot tell you
- COT Glossary — key terms defined
- Interactive Dashboard — current gold COT positioning data