FAQ: COT Data for Beginners
Feb 17, 2026
This page answers the questions that come up most often from traders new to the COT report. No jargon, no filler — just direct answers.
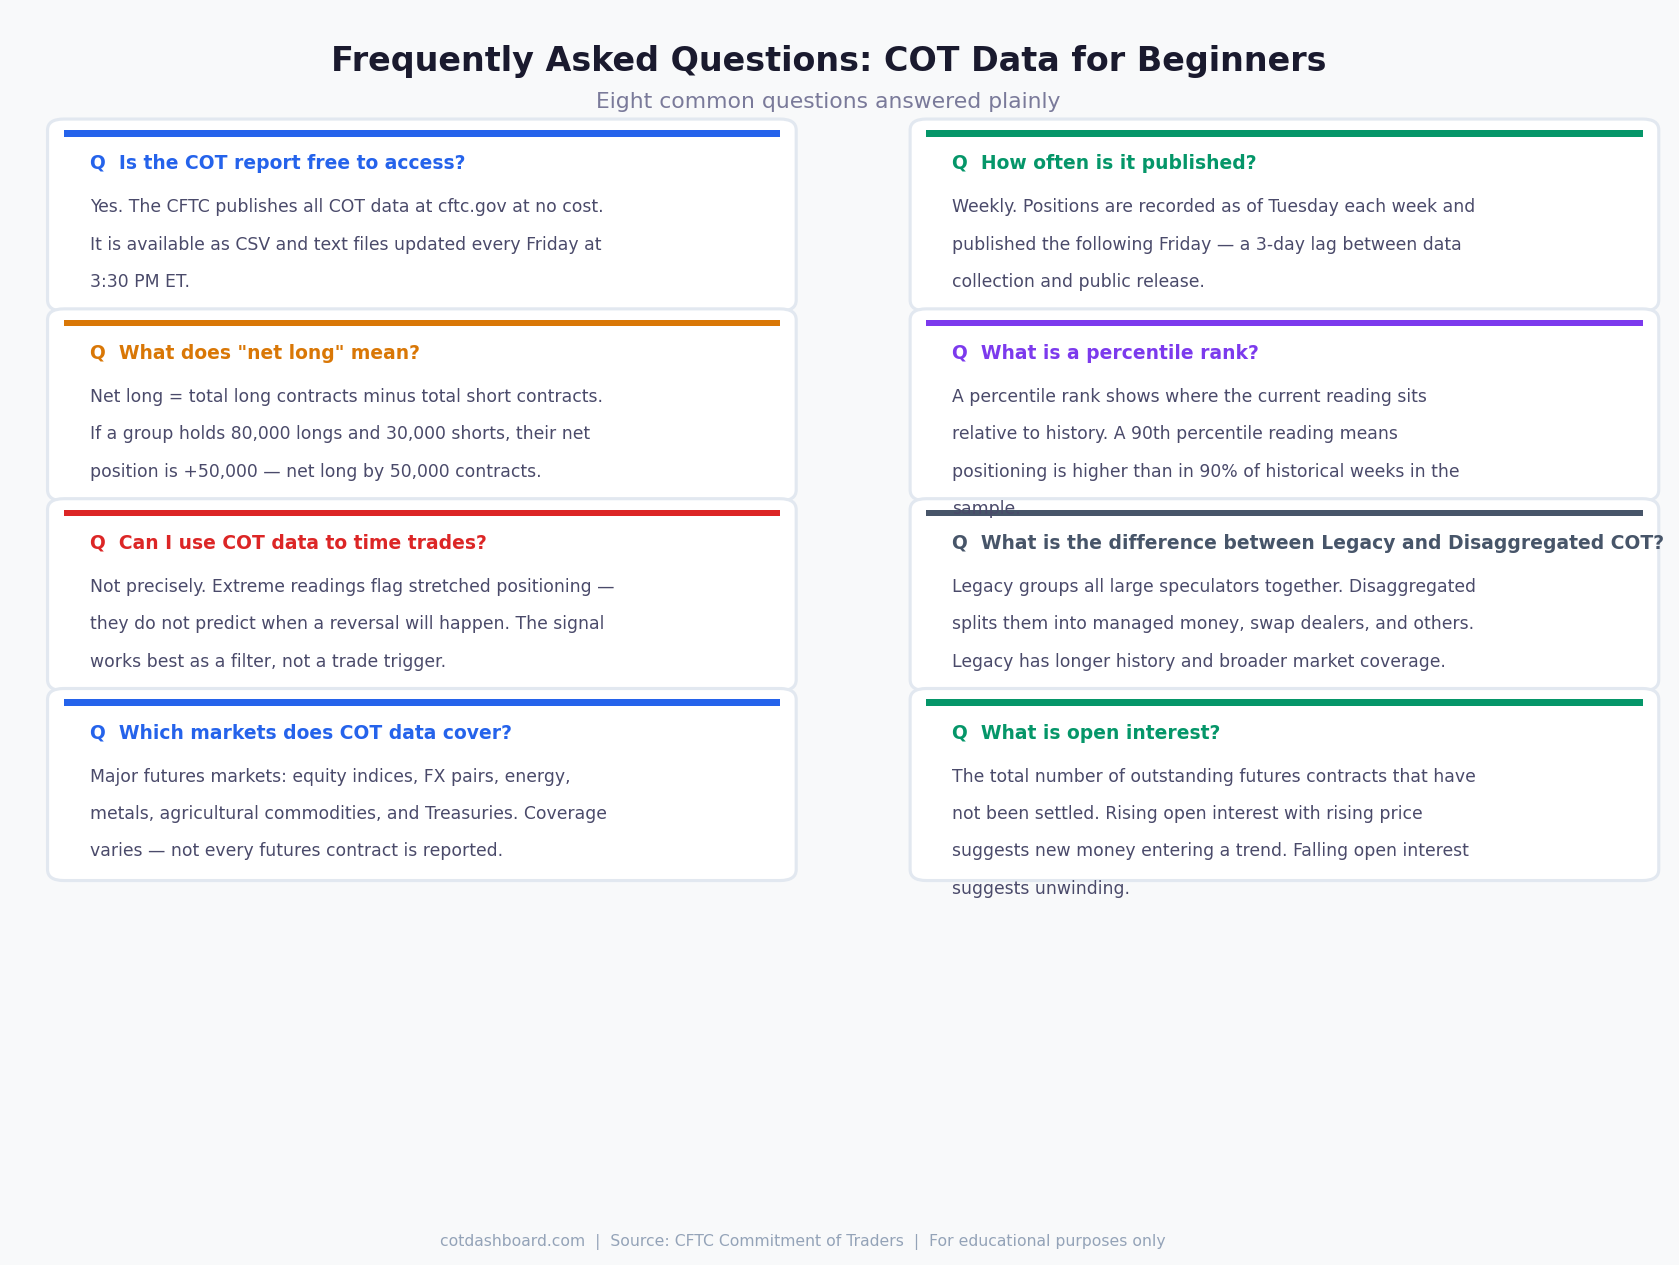
Is the COT report free to access?
Yes. The CFTC publishes all COT data at cftc.gov at no cost. It is available in CSV and legacy text formats, updated every Friday at 3:30 PM Eastern Time.
The raw data files are functional but not user-friendly — they contain hundreds of markets in a flat text format. Most traders use a third-party tool or dashboard (like cotdashboard.com) that processes and visualises the data.
How often is the COT report published?
Weekly. The CFTC records positions as of Tuesday each week and publishes the report the following Friday at 3:30 PM ET.
This creates a 3-day lag between data collection and public release. By the time you see the report, it is already three trading days old. In fast-moving markets, positions can change significantly in that window.
What does "net long" mean?
Net long = total long contracts minus total short contracts.
If a trader group holds 80,000 long contracts and 30,000 short contracts, their net position is +50,000 — they are net long by 50,000 contracts.
A positive net position means the group is betting on higher prices overall. A negative net position (net short) means they are positioned for lower prices.
What does "net short" mean?
The opposite of net long. If a group holds more short contracts than long contracts, their net position is negative — they are net short.
For commercial hedgers (producers, processors), being net short is normal and does not necessarily signal a bearish view. A grain farmer selling futures to lock in prices will be net short regardless of where they think prices are going. For non-commercial speculators, net short does reflect a directional bearish view.
What is a percentile rank in COT data?
A percentile rank shows where the current positioning reading sits relative to its own history.
If the current net long position is at the 90th percentile, it means it is higher than in 90% of historical weeks in the comparison window. The cotdashboard.com platform uses a 104-week (2-year) rolling window.
Percentile ranks solve a real problem: raw contract numbers are not comparable across markets or across time. A net long position of 100,000 contracts means very different things in crude oil versus wheat. Percentile ranks normalise this, making cross-market comparisons valid.
What are the extreme zones?
The cotdashboard.com dashboard uses five zones:
| Zone | Percentile range | Interpretation |
|---|---|---|
| Extreme Net Long | 95–100th | Historically very high speculative longs |
| Above Average | 75–95th | Elevated but not extreme |
| Mid-Range | 25–75th | No unusual signal |
| Below Average | 5–25th | Reduced speculative exposure |
| Extreme Net Short | 0–5th | Historically very low (or net short) |
Readings in the extreme zones (top or bottom 5%) are where COT analysis generates the most discussion. See What Are Percentile Rankings in COT Data? for a full explanation.
Can I use COT data to time trades?
Not precisely. This is one of the most important things to understand before using the report.
Extreme COT readings flag when speculative positioning is historically stretched. They do not predict when — or even whether — a reversal will happen. A market at the 97th percentile can reach the 99th. It can stay above the 95th for 20 consecutive weeks.
COT data works best as a filter and context tool. It tells you when a market is crowded, which should affect how you size and manage positions — not necessarily whether to enter or exit immediately.
What is the difference between Legacy and Disaggregated COT?
The Legacy COT is the original format. It divides participants into three groups: Commercials, Non-Commercials, and Non-Reportable.
The Disaggregated COT was introduced in 2009. It splits non-commercials into four sub-groups: Producers/Merchants, Swap Dealers, Managed Money, and Other Reportables. This gives a clearer picture of who is doing what, but covers fewer markets and has a shorter history.
For most COT analysis, including the cotdashboard.com dashboard, the legacy format is used — it has broader coverage and a longer historical record.
Which markets does COT data cover?
The legacy COT report covers most major US futures markets, including:
- Equity indices: S&P 500, Nasdaq 100, Dow Jones, Russell 2000
- FX: EUR, GBP, JPY, CHF, CAD, AUD, NZD, MXN, BRL
- Energy: Crude oil (WTI and Brent), natural gas, heating oil, RBOB gasoline
- Metals: Gold, silver, copper, platinum, palladium
- Agricultural: Corn, wheat, soybeans, soy oil, soy meal, cotton, sugar, coffee, cocoa
- Bonds: 2-year, 5-year, 10-year, and 30-year US Treasuries
Not every futures contract is reported. Smaller or less liquid contracts may be excluded or bundled.
What is open interest?
Open interest is the total number of outstanding futures contracts that have not yet been settled or closed.
It is different from trading volume. Volume counts how many contracts were traded in a session. Open interest counts how many are still open — held overnight.
Rising open interest alongside rising prices generally suggests new money is entering the trend — a healthy sign for trend continuation. Falling open interest alongside rising prices suggests short covering rather than new buying — a weaker signal.
COT data is published as a proportion of total open interest, which helps contextualise position sizes across markets.
Where should I start?
If you are new to COT data, the recommended reading order is:
- What Is the COT Report? — the foundation
- How to Read COT Data — practical walkthrough
- What Are Percentile Rankings in COT Data? — understanding the signal
- Commercial vs Non-Commercial Traders — understanding who is who
- COT Data Limitations — what the data cannot tell you
Once those are clear, the market-specific guides (energy, metals, FX, etc.) give context for individual markets.
Still have a question? The COT Glossary covers key terms, and the Methodology page explains exactly how the dashboard calculates its readings.